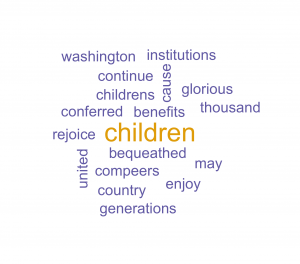
An update to the wordcloud package (2.2) has been released to CRAN. It includes a number of improvements to the basic wordcloud. Notably that you may now pass it text and Corpus objects directly. as in:
#install.packages(c("wordcloud","tm"),repos="http://cran.r-project.org")
library(wordcloud)
library(tm)
wordcloud("May our children and our children's children to a
thousand generations, continue to enjoy the benefits conferred
upon us by a united country, and have cause yet to rejoice under
those glorious institutions bequeathed us by Washington and his
compeers.",colors=brewer.pal(6,"Dark2"),random.order=FALSE)
data(SOTU)
SOTU <- tm_map(SOTU,function(x)removeWords(tolower(x),stopwords()))
wordcloud(SOTU, colors=brewer.pal(6,"Dark2"),random.order=FALSE)
This bigest improvement in this version though is a way to make your text plots more readable. A very common type of plot is a scatterplot, where instead of plotting points, case labels are plotted. This is accomplished with the text function in base R. Here is a simple artificial example:
states <- c('Alabama', 'Alaska', 'Arizona', 'Arkansas',
	'California', 'Colorado', 'Connecticut', 'Delaware',
	'Florida', 'Georgia', 'Hawaii', 'Idaho', 'Illinois',
	'Indiana', 'Iowa', 'Kansas', 'Kentucky', 'Louisiana',
	'Maine', 'Maryland', 'Massachusetts', 'Michigan', 'Minnesota',
	'Mississippi', 'Missouri', 'Montana', 'Nebraska', 'Nevada',
	'New Hampshire', 'New Jersey', 'New Mexico', 'New York',
	'North Carolina', 'North Dakota', 'Ohio', 'Oklahoma', 'Oregon',
	'Pennsylvania', 'Rhode Island', 'South Carolina', 'South Dakota',
	'Tennessee', 'Texas', 'Utah', 'Vermont', 'Virginia', 'Washington',
	'West Virginia', 'Wisconsin', 'Wyoming')

loc <- rmvnorm(50,c(0,0),matrix(c(1,.7,.7,1),ncol=2))

plot(loc[,1],loc[,2],type="n")
text(loc[,1],loc[,2],states)
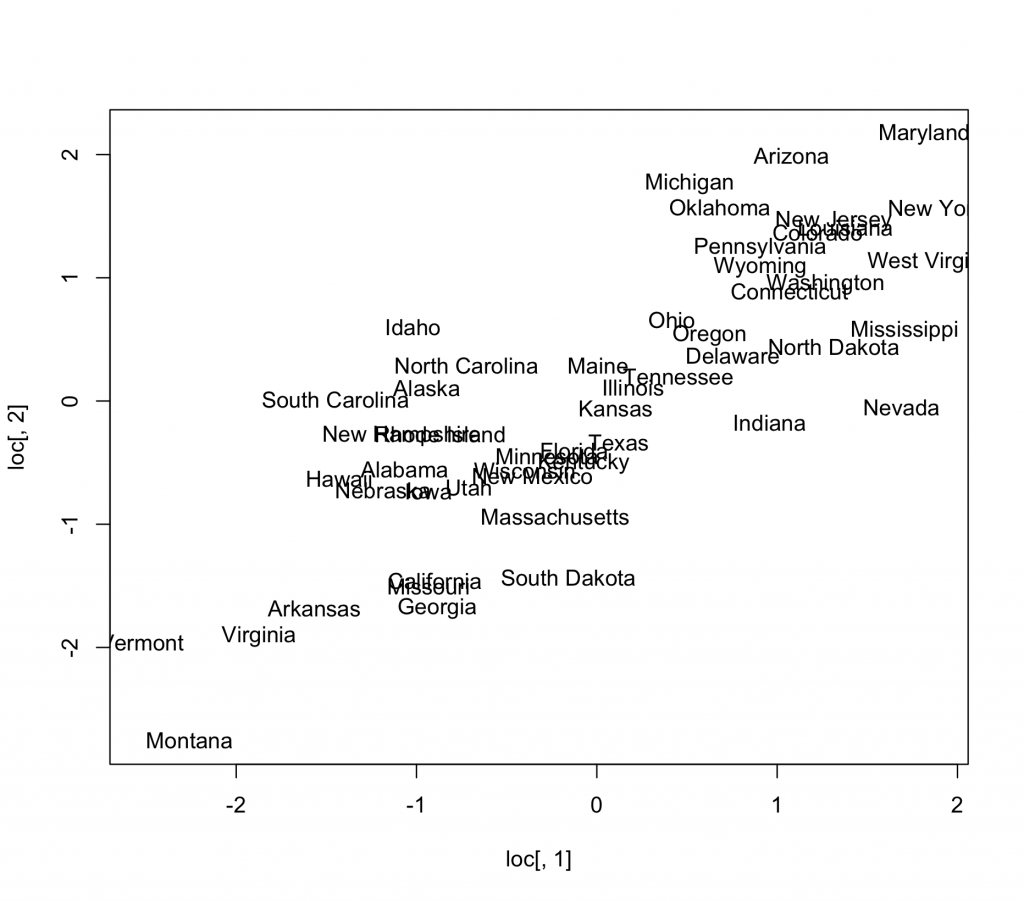
Notice how many of the state names are unreadable due to overplotting, giving the scatter plot a cloudy appearance. The textplot function in wordcloud lets us plot the text without any of the words overlapping.
textplot(loc[,1],loc[,2],states)
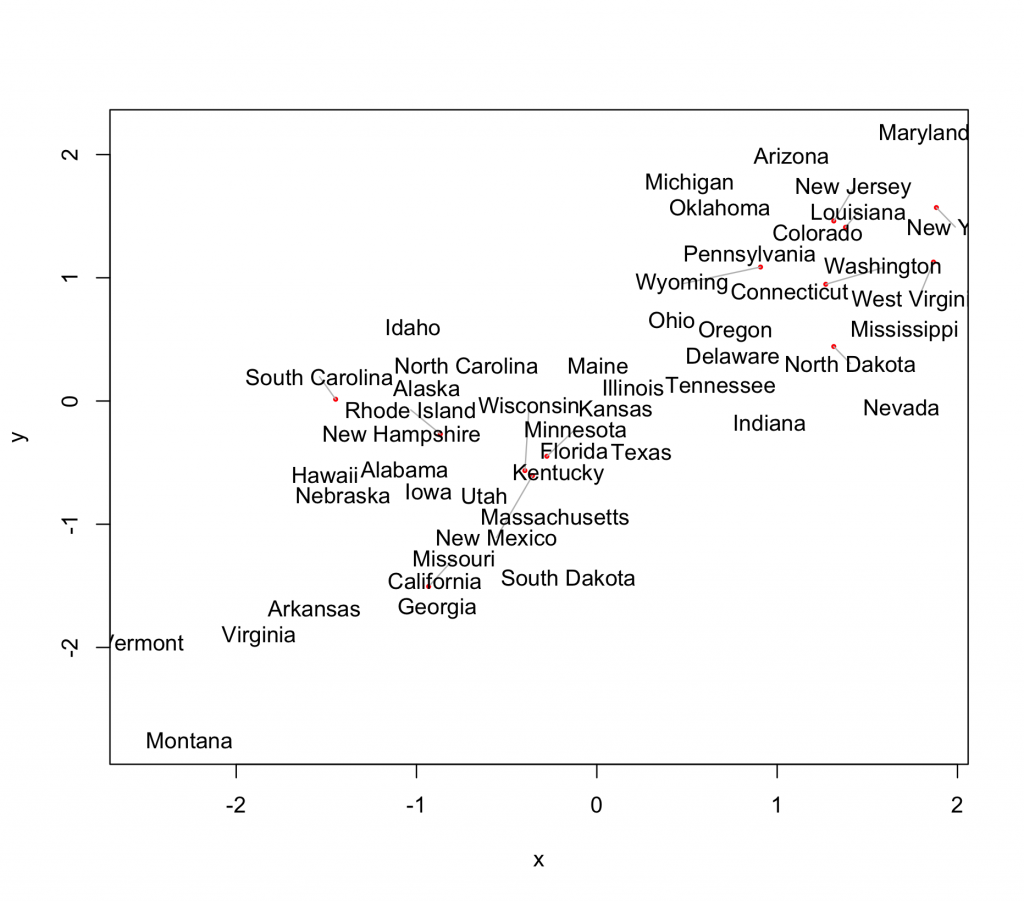
A big improvement! The only thing still hurting the plot is the fact that some of the states are only partially visible in the plot. This can be fixed by setting x and y limits, whch will cause the layout algorithm to stay in bounds.
mx <- apply(loc,2,max)
mn <- apply(loc,2,min)
textplot(loc[,1],loc[,2],states,xlim=c(mn[1],mx[1]),ylim=c(mn[2],mx[2]))
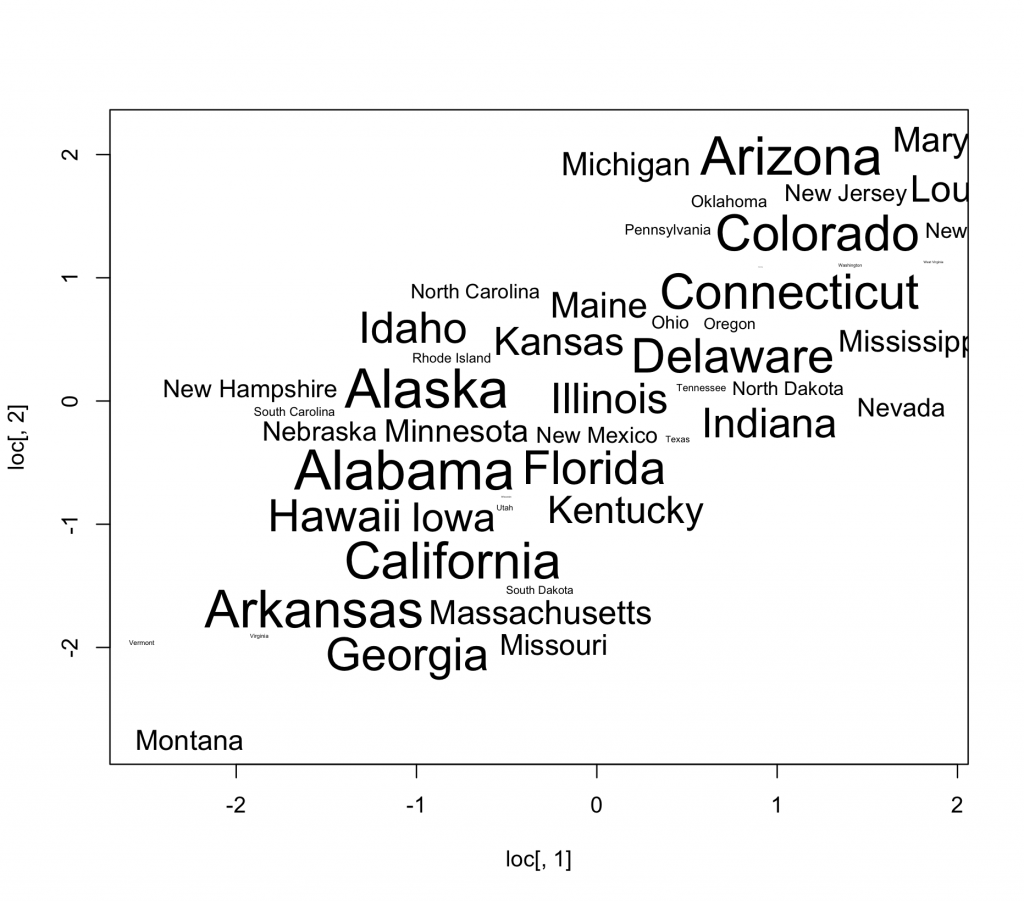
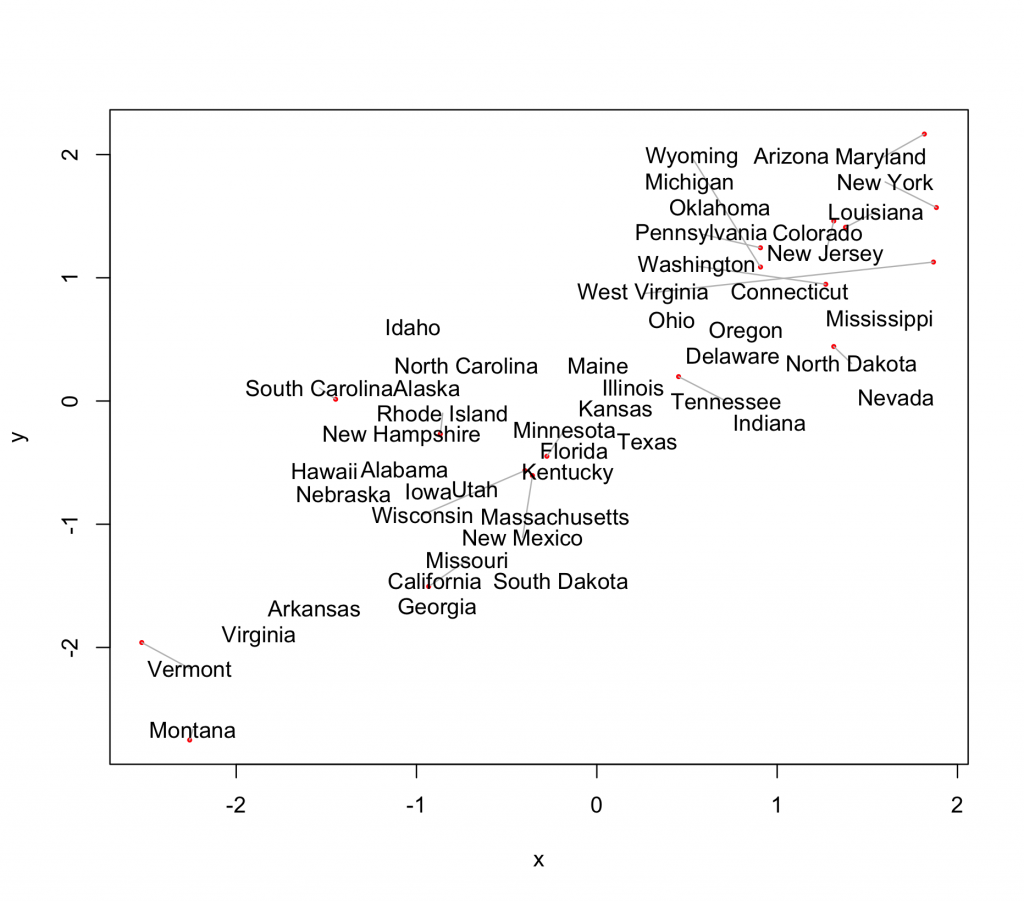 Another great thing with this release is that the layout algorithm has been exposed so you can create your own beautiful custom plots. Just pass your desired coordinates (and word sizes) to wordlayout, and it will return bounding boxes close to the originals, but with no overlapping.
plot(loc[,1],loc[,2],type="n")
nc <- wordlayout(loc[,1],loc[,2],states,cex=50:1/20)
text(nc[,1] + .5*nc[,3],nc[,2]+.5*nc[,4],states,cex=50:1/20)
okay, so this one wasn’t very creative, but it begs for some further thought. Now we have word clouds where not only the size can mean something, but also the x/y position (roughly) and color. Done right, this could add whole new layer of statistical richness to the visually pleasing but statistically shallow standard wordcloud.

8 replies on “wordcloud makes words less cloudy”
[…] used them to visualise the speeches of Kevin Rudd and Malcolm Turnbull. I have now learned from the Fell Stats blog (via R-Bloggers) that there is an R package for generating word clouds. The package makes use […]
Ian,
thanks for the wordcloud package. Your post inspired me to create the title page for my presentation on Using R in Insurance (http://lamages.blogspot.co.uk/2012/09/using-r-in-insurance-at-giro-2012.html).
Best regards
Markus
Nice!
Great. Bit of help if poss – could you explain the use of rmvnorm in the ‘state’ example? Thanks.
Thanks for the nice post on the wordcloud updates. I downloaded the new version, but it won’t build without Rcpp as a dependency – and I can’t find Rcpp anymore in the list of available packages! How did you solve this problem? Thanks in advance… –Nicole
Well, crop is definily there: http://cran.r-project.org/web/packages/Rcpp/index.html . Try upgrading your R to 2.15.1
Nevermind – found it at http://cran.r-project.org/web/packages/Rcpp/index.html and installed from a local zip file!
Yep… looks like the version of Rcpp I downloaded won’t work without R 2.15.1 – time to upgrade. Thanks!