I’m usually quite a big fan of the content syndicated on R-Bloggers (as this post is), but I came across a post yesterday that was as statistically misguided as it was provocative. In this post, entitled “The Surprisingly Weak Case for Global Warming,” the author (Matt Asher) claims that the trend toward hotter average global temperatures over the last 130 years is not distinguishable from statistical noise. He goes on to conclude that “there is no reason to doubt our default explaination of GW2 (Global Warming) – that it is the result of random, undirected changes over time.”
These are very provocative claims which are at odds with the vast majority of the extensive literature on the subject. So this extraordinary claim should have a pretty compelling analysis behind it, right?…
Unfortunately that is not the case. All of the author’s conclusions are perfectly consistant with applying an unreasonable model, inappropriate to the data. This in turn leads him to rediscover regression to the mean. Note that I am not a climatologist (neither is he), so I have little relevant to say about global warming per se, rather this post will focus on how statistical methodologies should pay careful attention to whether the data generation process assumed is a reasonable one, and how model misspecification can lead to professional embarrassment.
His Analysis
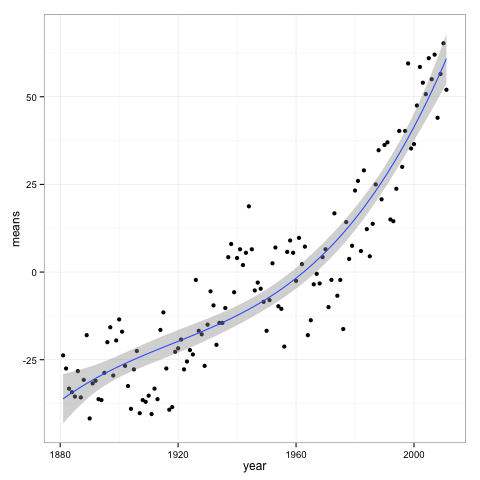
First, let’s review his methodology. He looked at the global temperature data available from NASA. It looks like this:
He then assumed that the year to year changes are independent, and simulated from that model, which yielded:
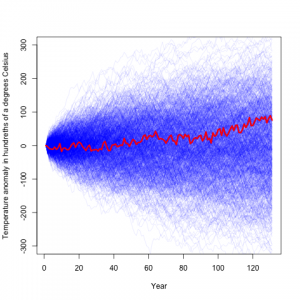 Here the blue lines are temperature difference records simulated from his model, and the red is the actual record. From this he concludes that the climate record is rather typical, and consistant with random noise.
A bit of a fly in the ointment though is that he found that his independence assumption does not hold. In fact he finds a negative correlation between one years temperature anomaly and the next:
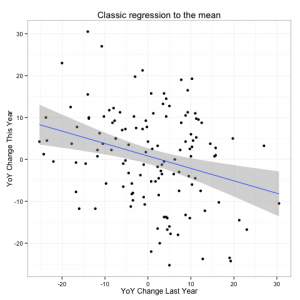 Any statistician worth his salt (and indeed several of the commenters noted) that this looks quite similar to what you would see if there were an unaccounted for trend leading to a regression to the mean.
Bad Model -> Bad Result
The problem with using an autoregressive model here is that it is not just last year’s temperatures which determine this year’s temperatures. Rather, it would seem to me as a non-expert, that temperatures from one year are not the driving force for temperatures for the next year (as an autoregressive model assumes). Rather there are underlying planetary constants (albedo and such) that give a baseline for what the temperature should be, and there is some random variation which cause some years to be a bit hotter, and some cooler.
Remember that first plot, the one with the cubic regression line. Let’s assume that data generation process is from that regression line, with the same variance of residuals. We can then simulate from the model to create an fictitious temperature record. The advantage of doing this is that we know the process that generated this data, and know that there exists a strong underlying trend over time.
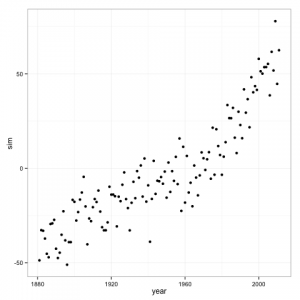
If we fit a cubic regression model to the data, which is the correct model for our simulated data generation process, it shows a highly significant trend.
              Sum Sq  Df F value    Pr(>F)
poly(year, 3)  91700   3  303.35 < 2.2e-16 ***
Residuals      12797 127
We know that this p-value (essentially 0) is correct because the model is the same as the one generating the data, but if we apply Mr. Asher’s model to the data we get something very different.
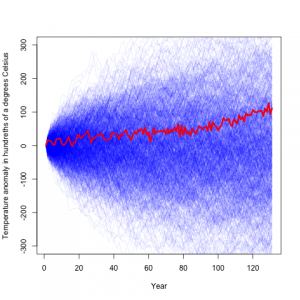
His model finds a non-significant p-value of .49. We can also see the regression to the mean in his model with this simulated data.
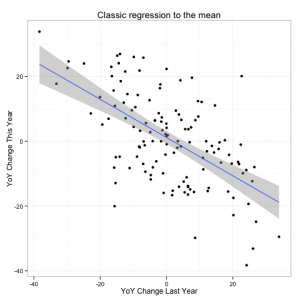
So, despite the fact that, after you adjust for the trend line, our simulated data is generating independent draws from a normal distribution, we see a negative auto-correlation in Mr. Asher’s model due to model misspecification.
Final Thoughts
What we have shown is that the model proposed by Mr. Asher to “disprove” the theory of global warming is likely misspecified. It fails to to detect the highly significant trend that was present in our simulated data. Furthermore, if he is to call himself a statistician, he should have known exactly what was going on because regression to the mean is a fundamental 100 year old concept.
———————-
The data/code to reproduce this analysis are available here.