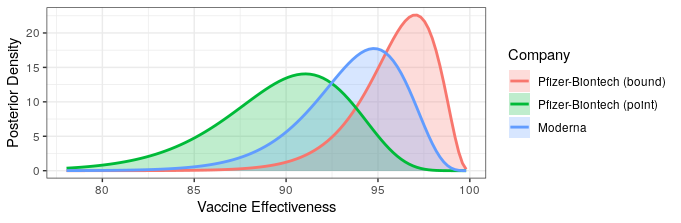
Okay, last one I swear. We just got updated results from the Pfizer-Biontech vaccine candidate. With 8 out of 170 cases belonging to the treatment group, the point estimate is remarkably similar to the Moderna preliminary results (~95% effectiveness). I will note that I was right in saying that the Pfizer-Biontech vaccine is likely much more effective than the 90% bound originally reported. Given that these are both very similar mRNA vaccines, the similarity in efficacy shouldn’t be radically surprising. Below is an updated plot of the posterior distribution for vaccine efficacy. I’ve added a “pooled” posterior, which assumes that the true efficacy is the same for both vaccines.
# reference: https://pfe-pfizercom-d8-prod.s3.amazonaws.com/2020-09/C4591001_Clinical_Protocol.pdf
# prior interval (matches prior interval on page 103)
qbeta(c(.025,.975),.700102,1)
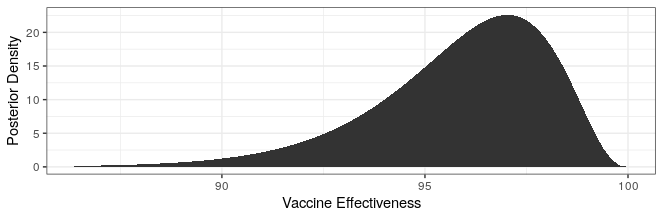
# posterior pfizer
cases_treatment <- 8
cases_control <- 170 - cases_treatment
theta_ci <- qbeta(c(.025,.975),cases_treatment+.700102,cases_control+1)
rate_ratio_ci <- theta_ci / (1-theta_ci)
# effectiveness
100 * (1 - rate_ratio_ci)
xx <- (1:90)/500
yy <- sapply(xx, function(x) dbeta(x,cases_treatment+.700102,cases_control+1))
xx <- 100 * (1 - xx / (1 - xx))
ggplot() +
geom_area(aes(x=xx,y=yy)) +
theme_bw() +
xlab("Vaccine Effectiveness") +
ylab("Posterior Density")
# posterior combined
cases_treatment <- 8 + 5
cases_control <- 170 + 95 - cases_treatment
theta_ci <- qbeta(c(.025,.975),cases_treatment+.700102,cases_control+1)
rate_ratio_ci <- theta_ci / (1-theta_ci)
# effectiveness
100 * (1 - rate_ratio_ci)
xx1 <- (1:90)/500
yy1 <- sapply(xx1, function(x) dbeta(x,cases_treatment+.700102,cases_control+1))
xx1 <- 100 * (1 - xx1 / (1 - xx1))
ggplot() +
geom_area(aes(x=xx1,y=yy1)) +
theme_bw() +
xlab("Vaccine Effectiveness") +
ylab("Posterior Density")
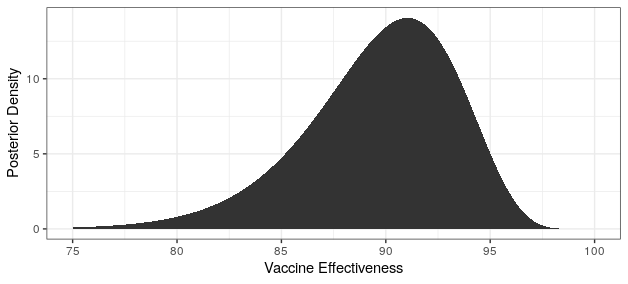
# posterior moderna
cases_treatment <- 5
cases_control <- 95 - cases_treatment
theta_ci <- qbeta(c(.025,.975),cases_treatment+.700102,cases_control+1)
rate_ratio_ci <- theta_ci / (1-theta_ci)
# effectiveness
100 * (1 - rate_ratio_ci)
xx2 <- (1:90)/500
yy2 <- sapply(xx2, function(x) dbeta(x,cases_treatment+.700102,cases_control+1))
xx2 <- 100 * (1 - xx2 / (1 - xx2))
ggplot() +
geom_area(aes(x=xx2,y=yy2)) +
theme_bw() +
xlab("Vaccine Effectiveness") +
ylab("Posterior Density")
df <- rbind(
data.frame(xx=xx,yy=yy,Company="Pfizer-Biontech"),
data.frame(xx=xx2,yy=yy2,Company="Moderna"),
data.frame(xx=xx1,yy=yy1,Company="Pooled")
)
ggplot(df) +
geom_area(aes(x=xx,y=yy,fill=Company),alpha=.25,position = "identity") +
geom_line(aes(x=xx,y=yy,color=Company),size=1) +
theme_bw() +
xlab("Vaccine Effectiveness") +
ylab("Posterior Density")
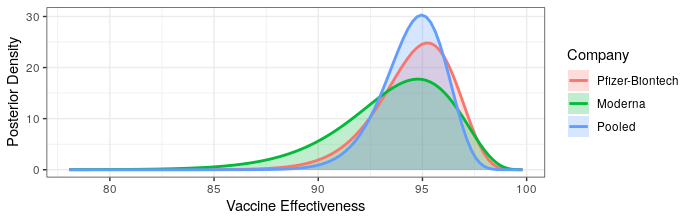
Both provide excellent protection. Really the only new information is that there is no meaningful difference in efficacy between the two, and hence no reason to prefer one over the other.
Some safety data was also reported:
A review of unblinded reactogenicity data from the final analysis which consisted of a randomized subset of at least 8,000 participants 18 years and older in the phase 2/3 study demonstrates that the vaccine was well tolerated, with most solicited adverse events resolving shortly after vaccination. The only Grade 3 (severe) solicited adverse events greater than or equal to 2% in frequency after the first or second dose was fatigue at 3.8% and headache at 2.0% following dose 2.
This is really good, and maybe even a bit better than Moderna's reported profile. I honestly don't know how to square this with higher averse event rates in the phase II study, where a significant number of participants had fevers after the second dose.
There were 10 severe cases of which 1 was in the treatment arm. Pooling the data from the Moderna and Pfizer studies, 7.1% of cases were severe in the treated arm versus 8.9% in the control. This difference is nowhere near significance though. So no real evidence yet that mRNA vaccines make illness milder should you be infected.
One thing that may have gone under the radar is this quote:
“We are grateful that the first global trial to reach the final efficacy analysis mark indicates that a high rate of protection against COVID-19 can be achieved very fast after the first 30 µg dose, underscoring the power of BNT162 in providing early protection,” said Ugur Sahin, M.D., CEO and Co-founder of BioNTech.
It appears that protection ramps up after the first shot, which is critical since we are in the midst of a huge surge in cases. We need immediate protection as soon as possible to reduce the death and reproductive rates.