Categories
Deducer R Shiny Video

Vivid: Toward A Next Generation Statistical User Interface

We are announcing the development of a new statistical user interface for R. I’m really excited about it and I hope that your will be too. Vivid is a rich document format deeply integrated with RStudio that mixes user interface elements, code and output. I firmly believe that the next million R users are going to fall in love with R first through the lens of a statistical user interface. Vivid aims to be that interface.

Vivid is in its developmental infancy, but we would love feedback and collaborators. If you are interested in testing and/or helping us build this tool, let us know!

https://github.com/fellstat/vivid

Categories
Deducer R

Interview by DecisionStats

Ajay Ohri interviewed
me
on his popular DecisionStats blog. Topics discussed
ranged widely from Fellows
Statistics
, to Deducer, to statnet, to Poker A.I.,
to Big Data.    

Categories
Deducer R

Deducer.org reaches 250,000 page views and continues to grow

It is difficult for R package authors to know how much (if at all) their packages are being used. CRAN does not calculate or make public download statistics (though this might change in the relatively near future), so authors can’t tell if 10 or 10,000 people are using their work.

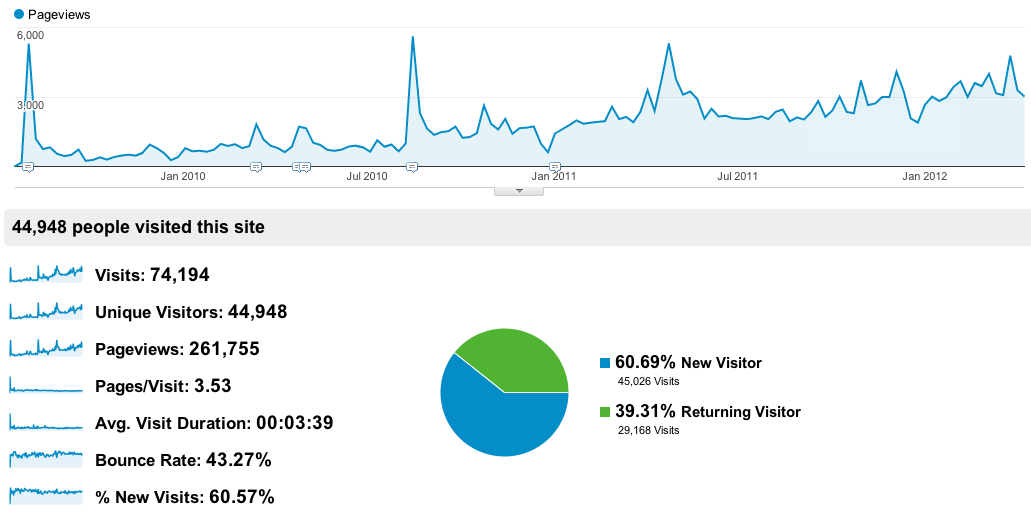
Deducer is in much the same boat. We can’t know how many people are downloading it, but we can get an idea of its usage by looking at how many people are accessing the online manual. The site recently passed the quarter of a million page view milestone, with close to 75k visits.

Deducer.org is now consistently getting over 3,000 page views a week, which is about 4-5 times greater than the same time 2 years ago. Traffic growth seems pretty consistant and surprisingly linear, indicating that we have a solid user base and adoption is progressing at a good rate. Exactly what the size of that user base is and the rate of adoption is something that can’t really be answered with raw traffic data, but the trends look unequivocally good.

With the addition of add-on packages like DeducerSpatial and DeducerPlugInScaling created by myself and a budding community of developers, I am very optimistic about the outlook for continued growth. If you have not given Deducer a try, either for personal use or in the classroom, now is a great time to start.


————————————–


Fellows Statistics provides experienced, professional statistical advice and analysis for the corporate and academic worlds.


Categories
Deducer R

Updates to the Deducer family of packages

Over the past month there have been a number of package updates in the deducer ecosystem. Deducer is a general purpose, extensible, data analysis GUI. It is designed to be a free easy to use alternative to proprietary data analysis software such as SPSS, JMP, and Minitab. It has a menu system to do common data manipulation and analysis tasks, and an excel-like spreadsheet in which to view and edit data frames.

More information is available in the online manual:

http://www.deducer.org/pmwiki/pmwiki.php?n=Main.DeducerManual

And there is an intro video in youtube:

Deducer 0.6-3

The main change in Deducer 0.6-3 is an update to the (award winning) Plot Builder GUI to make use of the new features in ggplot2 0.9-0.

New plot builder features: Part 1

New plot builder features: Part 2

DeducerSpatial 0.4

A Deducer plug-in for spatial data analysis. Includes The ability to plot and explore open street map and Bing satellite images. Currently there is not much here in terms of heavy data analysis, but there are some great tools for importing and exploring spatial data.

DeducerPlugInScaling 0.1-0

A Deducer plug-in for factor analysis, reliability analysis and discriminant analysis.

Version 0.1-0 includes some general improvements as well as a dialog for linear discriminant analysis (thanks to Helios De Rosario-Martinez).

http://www.deducer.org/pmwiki/pmwiki.php?n=Main.LinearDiscriminantAnalysis

DeducerExtras 1.5

Added functionality for Deducer. This package includes additional dialogs for calculating distribution function values, cluster analysis, and more.

Version 1.5 includes some general improvements along with a new dialog implementing Friedman’s test, and Kendall’s W test (thanks to Helios De Rosario-Martinez).

http://www.deducer.org/pmwiki/pmwiki.php?n=Main.RankingAnalysis

Categories
Deducer R Video

A Spatial Data Analysis GUI for R

I am excited to announce the addition of DeducerSpatial to the Deducer plug-in ecosystem. DeducerSpatial is a graphical user interface for the visualization and analysis of spatial data, built on Deducer’s plug-in platform. In a previous post I illustrated how to user DeducerSpatial from the command line to add Open Street Map images to your R plots. In the video below, I provide a quick tour of the GUI.

To try it out for yourself:

  1. Install Deducer (Instructions)
  2. Open JGR
  3. Enter the following into the console: install.packages(“DeducerSpatial”,,”http://cran.r-project.org”)
  4. Once DeducerSpatial is loaded ( library(DeducerSpatial) ), you can type data(states) or data(LA_places) to bring in some data to play around with.


video link


Categories
Deducer JGR R Uncategorized Video

Reading Excel data is easy with JGR and XLConnect

Despite the fact that Excel is the most widespread application for data manipulation and (perhaps) analysis, R’s support for the xls and xlsx file formats has left a lot to be desired. Fortunately, the XLConnect package has been created to fill this void, and now JGR 1.7-8 includes integration with XLConnect package to load .xls and .xlsx documents into R.

Not fancy, but very useful.

Categories
Deducer R Uncategorized

Open Street maps

There have been some exciting developments in the Deducer ecosystem over the summer which should go into CRAN release in the next few months. Today I’m going to give a quick sneak peek at an Open Street Map – R connection with accompanying GUI. This post will just show the non-GUI components.

The first part of the project was to create a way to download and plot Open Street Map data from either Mapnik or Bing in a local R instance. Before we can do that however, we need to install DeducerSpatial.

install.packages(c("Deducer","sp","rgdal","maptools"))
install.packages("UScensus2000")

#get development versions
install.packages(c("JGR","Deducer"),,"http://rforge.net",type="source")
install.packages("DeducerSpatial",,"http://r-forge.r-project.org",type="source")

Note that you will need rgdal. And you will need your development tools to install the development versions of JGR, Deducer and DeducerSpatial.

Plot an Open Street Map Image

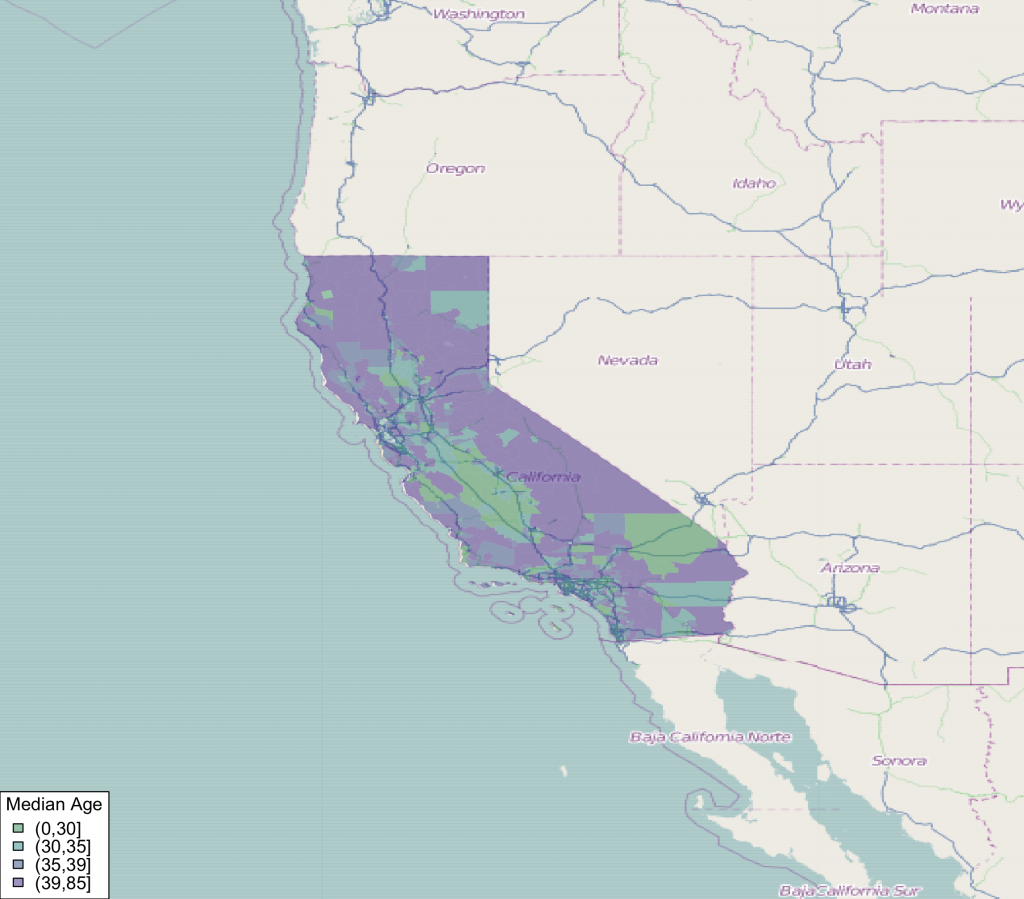
We are going to take a look at the median age of households in the 2000 california census survey. First, lets see if we can get the open street map image for that area.


#load package
library(DeducerSpatial)
library(UScensus2000)

#create an open street map image
lat <- c(43.834526782236814,30.334953881988564)
lon <- c(-131.0888671875  ,-107.8857421875)
southwest <- openmap(c(lat[1],lon[1]),c(lat[2],lon[2]),zoom=5,'osm')
plot(southwest,raster=FALSE)

Note that plot has an argument ‘raster’ which determines if the image is plotted as a raster image. ‘zoom’ controls the level of detail in the image. Some care needs to be taken in choosing the right level of zoom, as you can end up trying to pull street level images for the entire world if you are not careful.


Make a Choropleth Plot

Next, we can add a choropleth to the plot. We bring in the census data from the UScensus2000 package, and transform it to the mercator projection using spTransform.


#load in califonia data and transform coordinates to mercator
data(california.tract)
california.tract <- spTransform(california.tract,osm())

#add median age choropleth
choro_plot(california.tract,dem = california.tract@data[,'med.age'],
	legend.title = 'Median Age')
 

Use Aerial Imagery

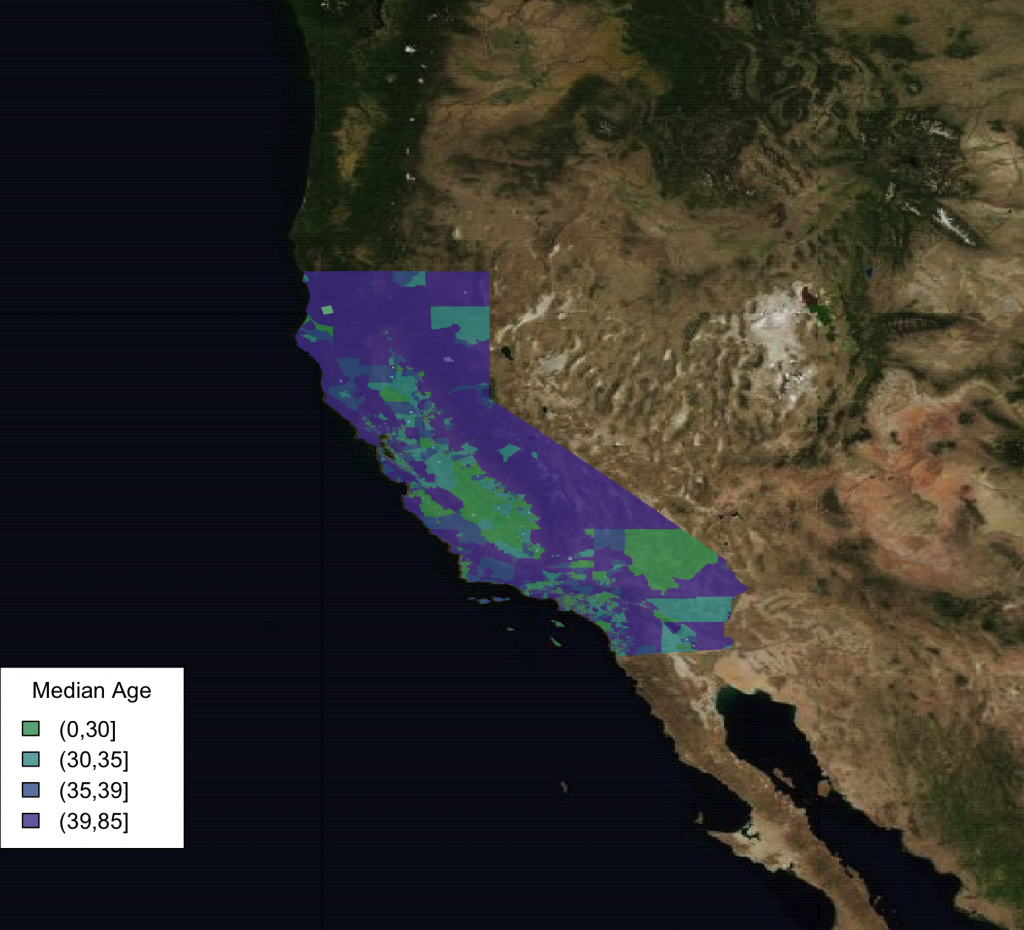
We can also easily use bing satellite imagery instead.

southwest <- openmap(c(lat[1],lon[1]),c(lat[2],lon[2]),5,'bing')
plot(southwest,raster=FALSE)
choro_plot(california.tract,dem = california.tract@data[,'med.age'],alpha=.8,
	legend.title = 'Median Age')


One other fun thing to note is that the image tiles are cached so they do not always need to be re-downloaded.


> system.time(southwest <- openmap(c(lat[1],lon[1]),c(lat[2],lon[2]),zoom=7,'bing'))
   user  system elapsed
  9.502   0.547  17.166
> system.time(southwest <- openmap(c(lat[1],lon[1]),c(lat[2],lon[2]),zoom=7,'bing'))
   user  system elapsed
  9.030   0.463   9.169


Notice how the elapsed time in the second call is half that of the first one, this is due to caching.

This just scratches the surface of what is possible with the new package. You can plot any type of spatial data (points, lines, etc.) supported by the sp package so long as it is in the mercator projection. Also, there is a full featured GUI to help you load your data and make plots, but I’ll talk about that in a later post.