Categories
Uncategorized

What to Expect When You Are Expecting the Delta Covid-19 Variant

SARS-Cov-2 (COVID-19) has been the defining driver of the market since its emergence. Understanding the progression of the disease through the world has been the secret sauce of alpha generation. Correctly parsing the early infectivity and morality data allowed some to avoid the COVID crash and a solid reading into phase II and phase III vaccine readouts in fall gave insight into the rebound.

As the novel coronavirus raged through the world infecting 181 million and killing 3.9 million (that we know about), the number of people with natural resistance, due to a previous SARS-Cov-2 infection rose. When the virus comes into contact with someone with a resistance, this creates an evolutionary pressure to evade that resistance and re-infect them. Viruses mutate the most when there are high infection rates and lots of people with resistance to it.

It should be no surprise then that more infective variants start to pop up over time, out competing the original strain in the virus’s single-minded goal of using all of us as incubators for self-reproduction. One particular variant of concern is the so-called Delta variant. In this article I’m going to take a look at where we stand with the Delta variant and take a stab at outlining what I view as the most likely trajectory moving forward.

The Delta Variant

The Delta variant emerged in India and is spreading rapidly on a global scale. There currently isn’t strong evidence that it has a much higher mortality rate compared to the original strain, which has a case fatality rate 10-40 times higher than seasonal influenza. Preliminary findings from England and Scotland point to hospitalization rates over 2 times higher than the original strain, so as more studies are performed it would not be surprising to find out that it has increased mortality.

Delta does appear to be much more infectious. Infectiousness can be measured a number of ways. One of these is the relative speed with which it becomes the dominant strain once it enters a population.

Picture1

Source: Campbell, Finlay, et al. “Increased transmissibility and global spread of SARS-CoV-2 variants of concern as at June 2021.” Eurosurveillance 26.24 (2021): 2100509.

The above chart shows the reproductive number (i.e. the number of people each infected individual infects) relative to the original strain of a number of variants that the global public health community is monitoring. You can see that Delta really breaks away from the pack in terms of infectiousness with a ~100% increase over “regular” SARS-CoV-2.

The original strain is roughly 2 times more infectious than the flu, so this new strain might be 4 times more infectious than seasonal flu. It is hard to overstate just how big a difference this is. The mitigation measures the world put into place in 2020 essentially eradicated seasonal influenza, and yet we still experienced wave after wave of Covid cases.

Where Is It?

The chart below shows the relative prevalence of each of the strains across a number of counties. It is an updated version of one shown in the linked paper that includes additional data collected over the last three weeks, which the authors have graciously allowed me to share.

Picture2

Source: Campbell, Finlay, et al. “Increased transmissibility and global spread of SARS-CoV-2 variants of concern as at June 2021.” Eurosurveillance 26.24 (2021): 2100509.

As we can see, Delta first broke out in India and spread to Bangladesh and the UK where it quickly became responsible for the bulk of infections.  Other countries are now seeing spread, with roughly 20% of US infections now being attributable to Delta.

India and Bangladesh both have very young populations, which affords some protection against the ravages of Covid, since the elderly experience the worst outcomes. Unfortunately, this demographic protection was not enough to avoid poor outcomes.

India experienced a well-documented outbreak that severely impacted the country’s people and economy.

Picture3

Source: https://91-divoc.com/pages/covid-visualization/

Bangladesh is still in the exponential growth phase of the Delta variant. We don’t yet know when it will peak.

Picture4

Source: https://91-divoc.com/pages/covid-visualization/

Moving onto developed counties, the UK has seen an explosion of cases corresponding to the introduction and growth of Delta. The interesting thing here is that while deaths have increased, they have increased by far less than one might expect looking at the last wave. Similarly, hospitalizations have increased, but not by that much. Why? One word: Vaccines.

Picture5

Source: https://91-divoc.com/pages/covid-visualization/

The vaccine rollout in the UK, as in the US, focused heavily on older age groups providing them with some protection against infection. As a result, the new infections are heavily weighted towards younger age groups that are less likely to be hospitalized and/or die.

Picture6

Source: The Spectator with data from the UK government

In the US, we are just starting to see the effect of the Delta variant. Reductions in case and death counts have stalled somewhat. We are still averaging ~300 deaths per day, which annualizes to ~100k dead per year. In my opinion, this remains an unacceptable death burden.

Picture7

Source: https://91-divoc.com/pages/covid-visualization/

The big question is where we are going to go from here? Delta becoming the dominant strain seems highly likely over the next month or so, but what effect will that have on US case/death counts? Will we follow the UK path?

Vaccines

Modern science has really come through with amazingly effective vaccines. The Pfizer and Moderna vaccines showed ~95% protection against the original strain. The AstraZeneca vaccine was~70% effective (though this was later revised to 76%).

The good news is that both Pfizer and AstraZeneca appear to remain effective against the Delta variant. Based on observational data, it has been estimated that Pfizer is 88% efficacious and AstraZeneca is 60% efficacious in preventing symptomatic disease. In preventing hospitalization, they are better, with sitting at about 96% and 92% efficacy respectively. While Moderna has not been studied, I would expect it to perform similarly to Pfizer based on how highly related the methodologies are.

The bad news is that these drop offs in efficacy amount to about a doubling of the number of breakthrough infections compared to the original variant. Also, the efficacy of a single dose is just ~33%, which is too low to provide much comfort. Thus, it is critical that follow-up shots are carried out. It also means that ramping up vaccination will take some time to show effectiveness since reasonable levels of efficacy may only be achieved two weeks after the second dose.

It is unclear how other vaccines perform against Delta. Of particular interest is the effectiveness of Sinovac and Sinopharm as these are being widely deployed in China. Given their rather lackluster performance against the other strains, I am worried but keeping my fingers crossed for them.

Base Case Disease Trajectory

Based on the currently available information, the most likely scenario is that the Delta variant continues to spread across the globe outcompeting other variants. Wealthy counties with higher vaccination rates will potentially see increasing case counts similar to the UK with less severe increases in hospitalization and death. While the US has slightly lower vaccination rates compared to the UK, it has used more mRNA efficacious vaccines, which provide superior protection against community spread. This mix of superior vaccines means that the US could have less of a case count increase compared to the UK.

With increasing case counts, vaccination uptake will likely improve. However, due to the one month lag time between first dose and robust protection, it may take some time before this change in behavior is reflected in the case count curves.

With rich countries vaccinating, it seems unlikely that a large proportion of people in developing nations will have access to vaccines for some time. While the demographic bias of these countries toward the young will blunt some of the impact, a similar scenario to what played out in India could become widespread.

The impact on China is uncertain and may chart a completely different trajectory. Vaccinations in their huge population are proceeding rapidly, but the effectiveness of the vaccines they are using against Delta is an unknown. The (somewhat draconian) public health mitigation measures they have put in place have done an exceedingly good job of curbing infection. It is unknown whether these mitigation measures will hold fast against a doubling of the reproductive rate.

Big Downside Risk

Every time an infected individual comes into contact with a person resistant to infection there is an evolutionary selection pressure to overcome that resistance. For most of the pandemic the resistance has stemmed from previous SARS-CoV-2 infection. Only recently have we had significant population percentages with vaccine-initiated resistance.

The base case scenario, where there are many infected people engaging in transmission in a population with many vaccinated individuals, is a dangerous mix that could potentially lead to a vaccine resistant variant. A variant that could bypass the protections afforded by vaccination would be a radically negative outcome both from a humanitarian and economic perspective.

Economic Impacts

Many people cite the lockdowns as the cause of all of the economic woes in the age of Covid-19. These people are wrong. Covid-19 infections, hospitalizations and deaths were the cause of the economic crisis. The lockdowns were a reflection of what most people were already doing in response to the risks that they saw. We know this because states with lockdowns experienced similar drops in mobility (a proxy for economic activity at the time) as those who had not yet implemented them.

The reason the economy is reopening is because the risk has decreased and people are acting accordingly. If risk increases people will respond to that risk by protecting themselves. At previous points in the pandemic this meant social distancing, reducing indoor activities, etc. These risk mitigation behaviors had severe economic consequences, especially for the services sector.

If deaths and hospitalizations do not rise dramatically, individuals may not see the need to engage in any risk mitigation. If they do engage in risk mitigation, unvaccinated US residents have the luxury of our large supply of vaccine and may choose vaccination as their mitigation behavior. Vaccination is free, easy and has little in the way of economic consequences.

Most emerging market countries have little protecting them from similar economic consequences to those experienced by India. The effect on China, the world’s second largest economy, is uncertain because the effect of Delta on that country is similarly uncertain.

Final thoughts

The Delta variant is roughly twice as infectious as “regular” SARS-CoV-2 (Covid-19), which is roughly twice as infectious as influenza. This huge increase has significant humanitarian and economic consequences for the world.

Vaccines have been unevenly distributed around the world, with developed countries taking the vast majority of the available doses. Looking at India and Bangladesh we can see that the spread of Delta to an unvaccinated population can lead to exponential growth in both cases and deaths. The UK, which has had one of the most successful vaccination programs in the world, was also hit by the Delta variant. Because of vaccination, these cases were concentrated in younger low-risk individuals and consequently the increase in death counts has been more modest.

Case counts in China remain negligible. The mitigation measures in place have been very successful at preventing other variants spreading in the country, but those variants are less infective than Delta. The Sinopharm and Sinovac vaccines are moderately effective, and have unknown efficacy against Delta.

I’ve tried to outline what I consider to be the most likely scenario, which is:

  1. Increasing case counts in developed countries with less severe increases in death counts.
  2. Increasing case and death counts in countries without access to vaccines.
  3. Uncertain trajectory for China.

This scenario is predicated on the data that we currently have available. Estimates of reproductive rate and vaccine effectiveness using observational data are challenging and our understanding is subject to potentially strong revisions.

The best thing we can do right now is vaccinate as many people as possible. Keeping case counts low, even among young people, decreases the selective pressure that leads to new, potentially worse, variants. Sharing vaccine with less developed nations helps blunt the impact of Delta variant spread on the most vulnerable groups.

I won’t lecture you on personal choices, but now is a particularly rational time to get vaccinated. The increased reproductive rate of the variant means there is a pretty good chance you’ll get infected if you are not vaccinated; maybe not in the next month, but the odds are good over a 5-year time horizon (unless you are a hermit). Given that vaccination is free, easy, and a whole lot nicer than even a mild case of Covid-19, getting vaccinated is a great way to hedge against a negative outcome that is probably pretty likely.

Categories
Uncategorized

Final Moderna + Pfizer Vaccine Efficacy Update

Okay, last one I swear. We just got updated results from the Pfizer-Biontech vaccine candidate. With 8 out of 170 cases belonging to the treatment group, the point estimate is remarkably similar to the Moderna preliminary results (~95% effectiveness). I will note that I was right in saying that the Pfizer-Biontech vaccine is likely much more effective than the 90% bound originally reported. Given that these are both very similar mRNA vaccines, the similarity in efficacy shouldn’t be radically surprising. Below is an updated plot of the posterior distribution for vaccine efficacy. I’ve added a “pooled” posterior, which assumes that the true efficacy is the same for both vaccines.

# reference: https://pfe-pfizercom-d8-prod.s3.amazonaws.com/2020-09/C4591001_Clinical_Protocol.pdf

# prior interval (matches prior interval on page 103)
qbeta(c(.025,.975),.700102,1)


# posterior pfizer
cases_treatment <- 8
cases_control <- 170 - cases_treatment
theta_ci <- qbeta(c(.025,.975),cases_treatment+.700102,cases_control+1)
rate_ratio_ci <- theta_ci / (1-theta_ci)

# effectiveness
100 * (1 - rate_ratio_ci)

xx <- (1:90)/500
yy <- sapply(xx, function(x) dbeta(x,cases_treatment+.700102,cases_control+1))
xx <- 100 * (1 - xx / (1 - xx))
ggplot() + 
  geom_area(aes(x=xx,y=yy)) + 
  theme_bw() + 
  xlab("Vaccine Effectiveness") + 
  ylab("Posterior Density")

# posterior combined
cases_treatment <- 8 + 5
cases_control <- 170 + 95 - cases_treatment
theta_ci <- qbeta(c(.025,.975),cases_treatment+.700102,cases_control+1)
rate_ratio_ci <- theta_ci / (1-theta_ci)

# effectiveness
100 * (1 - rate_ratio_ci)

xx1 <- (1:90)/500
yy1 <- sapply(xx1, function(x) dbeta(x,cases_treatment+.700102,cases_control+1))
xx1 <- 100 * (1 - xx1 / (1 - xx1))
ggplot() + 
  geom_area(aes(x=xx1,y=yy1)) + 
  theme_bw() + 
  xlab("Vaccine Effectiveness") + 
  ylab("Posterior Density")


# posterior moderna
cases_treatment <- 5
cases_control <- 95 - cases_treatment
theta_ci <- qbeta(c(.025,.975),cases_treatment+.700102,cases_control+1)
rate_ratio_ci <- theta_ci / (1-theta_ci)

# effectiveness
100 * (1 - rate_ratio_ci)


xx2 <- (1:90)/500
yy2 <- sapply(xx2, function(x) dbeta(x,cases_treatment+.700102,cases_control+1))
xx2 <- 100 * (1 - xx2 / (1 - xx2))
ggplot() + 
  geom_area(aes(x=xx2,y=yy2)) + 
  theme_bw() + 
  xlab("Vaccine Effectiveness") + 
  ylab("Posterior Density")


df <- rbind(
  data.frame(xx=xx,yy=yy,Company="Pfizer-Biontech"),
  data.frame(xx=xx2,yy=yy2,Company="Moderna"),
  data.frame(xx=xx1,yy=yy1,Company="Pooled")
)
ggplot(df) + 
  geom_area(aes(x=xx,y=yy,fill=Company),alpha=.25,position = "identity") + 
  geom_line(aes(x=xx,y=yy,color=Company),size=1) + 
  theme_bw() + 
  xlab("Vaccine Effectiveness") + 
  ylab("Posterior Density")

vac3

Both provide excellent protection. Really the only new information is that there is no meaningful difference in efficacy between the two, and hence no reason to prefer one over the other.

Some safety data was also reported:

A review of unblinded reactogenicity data from the final analysis which consisted of a randomized subset of at least 8,000 participants 18 years and older in the phase 2/3 study demonstrates that the vaccine was well tolerated, with most solicited adverse events resolving shortly after vaccination. The only Grade 3 (severe) solicited adverse events greater than or equal to 2% in frequency after the first or second dose was fatigue at 3.8% and headache at 2.0% following dose 2.

This is really good, and maybe even a bit better than Moderna's reported profile. I honestly don't know how to square this with higher averse event rates in the phase II study, where a significant number of participants had fevers after the second dose.

There were 10 severe cases of which 1 was in the treatment arm. Pooling the data from the Moderna and Pfizer studies, 7.1% of cases were severe in the treated arm versus 8.9% in the control. This difference is nowhere near significance though. So no real evidence yet that mRNA vaccines make illness milder should you be infected.

One thing that may have gone under the radar is this quote:

“We are grateful that the first global trial to reach the final efficacy analysis mark indicates that a high rate of protection against COVID-19 can be achieved very fast after the first 30 µg dose, underscoring the power of BNT162 in providing early protection,” said Ugur Sahin, M.D., CEO and Co-founder of BioNTech.

It appears that protection ramps up after the first shot, which is critical since we are in the midst of a huge surge in cases. We need immediate protection as soon as possible to reduce the death and reproductive rates.

Categories
R Uncategorized

The Pfizer-Biontech Vaccine May Be A Lot More Effective Than You Think

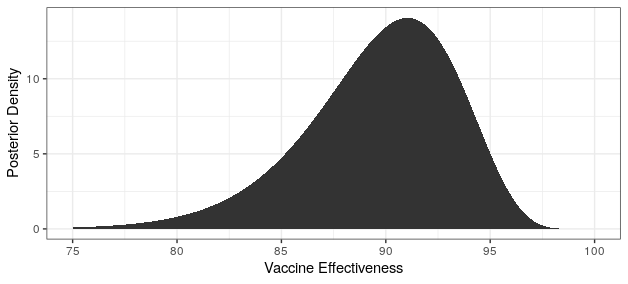
tl;dr; The point estimate for vaccine effectiveness may be 97%, which is a lot higher than 90%

Yesterday an announcement went out that the SARS-CoV-2 vaccine candidate developed by Pfizer and Biontech was determined to be effective during an interim analysis. This is fantastic news. Perhaps the best news of the year. It is however another example of science via press release. There is very limited information contained in the press release and one can only wonder why they couldn’t take the time to write up a two page report for the scientific community.

That said, we can draw some inferences from the release that may help put this in context. From the press release we know that a total of 94 COVID-19 cases were recorded.

“Upon the conclusion of those discussions, the evaluable case count reached 94 and the DMC performed its first analysis on all cases. “

However, we don’t know how many of these come from the control group, and how many come from the treatment group. We also don’t know how many total subjects are in the treatment and control arms. We do get two important quotes regarding efficacy.

“Vaccine candidate was found to be more than 90% effective in preventing COVID-19 in participants without evidence of prior SARS-CoV-2 infection in the first interim efficacy analysis

The case split between vaccinated individuals and those who received the placebo indicates a vaccine efficacy rate above 90%, at 7 days after the second dose.”

How should we interpret these? Was the observed rate of infection 90% lower in the treatment group, or are we to infer that the true (population parameter) efficacy is at least 90%? I would argue that the wording supports the later. If they were just providing a point estimate why express it as a bound? Why would they phrase it as “indicates a vaccine efficacy rate above 90%” if there was a reasonable probability that the actual vaccine efficacy rate is below 90%?

We can get some additional insight by looking at the study design. It specifies how the interim analysis is to be done. Specifically on pages 102-103, it calls for a Bayesian analysis using a beta binomial model with a weakly-informative prior.

To me, the most compatible statistical translation of their press release is that we are sure with 95% probability that the vaccine’s efficacy is greater than 90%. Why “95% probability?” Well, 95% probability intervals are standard for the medical literature if you are doing Bayesian analysis (deal with it), and 95% intervals with 2.5% probabilities on each tail are littered through the design document. They are going to the FDA with these claims, so they will likely stick to the standard evidentiary rules.

Assuming my interpretation is correct, let’s back out how many cases were in the treatment group. Conditional on the total number of infections, the number of infections in the treatment group is distributed binomially. We apply the beta prior to this posterior and then transform our inferences from the binomial proportion to vaccine effectiveness. Vaccine effectiveness is one minus the infection rate ratio between the two groups, and the rate ratio is related to the binomial proportion as the odds.

> # reference: https://pfe-pfizercom-d8-prod.s3.amazonaws.com/2020-09/C4591001_Clinical_Protocol.pdf
> 
> # prior interval (matches prior interval on page 103)
> qbeta(c(.025,.975),.700102,1)
[1] 0.005148448 0.964483043
> 
> 
> # posterior
> cases_treatment <- 3
> cases_control <- 94 - cases_treatment
> theta_ci <- qbeta(c(.025,.975),cases_treatment+.700102,cases_control+1)
> rate_ratio_ci <- theta_ci / (1-theta_ci)
> 
> # effectiveness
> 100 * (1 - rate_ratio_ci)
[1] 98.98688 90.68447
> library(ggplot2)
> xx <- (0:60)/500
> yy <- sapply(xx, function(x) dbeta(x,cases_treatment+.700102,cases_control+1))
> xx <- 100 * (1 - xx / (1 - xx))
> ggplot() + 
+   geom_area(aes(x=xx,y=yy)) + 
+   theme_bw() + 
+   xlab("Vaccine Effectiveness") + 
+   ylab("Posterior Density")

The largest number of treatment cases that would have a lower bound greater than 90% is 3, corresponding to 91 cases in the control group. The estimated effectiveness of the vaccine is then 97% with a probability interval from 90.7% to 99.0%. So sure, the effectiveness could be 90% or so, but odds are that it is a lot higher as the posterior plot below shows.

vaccine

To put this in perspective, consider the rates at which a 97% effective vaccine fails to provide protection, leading to an infection. A 90% effective vaccine has a 3.3 times higher failure rate, so if you vaccinated a population with a 90% effective vaccine and everyone was exposed you’d expect to see 3.3 times more infections compared to if you had used a 97% effective vaccine.

I do note that the analysis plan calls for sequential stopping rules that preserve type I error; however, I don’t believe that any reported statistics would be adjusted for that. Unlike frequentist intervals, Bayesian intervals are unchanged no matter how many interim analyses you do.

There is a lot we don’t know, and hopefully we will get more scientific clarity in the coming weeks. As it stands now, it seems like this vaccine has efficacy way above my baseline expectations, perhaps even in the 97% range or higher.

I could be wrong in my interpretation of the press release, and they are in fact talking about the sample effectiveness rather than the true effectiveness. In that case, 8 of the 94 cases would have been in the treatment group, and the interval for the true effectiveness would be between 81.6% and 95.6%. The posterior distribution would look pretty darn good, but not quite as nice as the previous one.

vaccine2

It is important to have realistic expectations though. Efficacy is not the only metric that is important in determining how useful the vaccine is. Due to the fact that the study population has only been followed for months, we do not know how long the vaccine provides protection for. There is significant evidence of COVID-19 reinfection, so the expectation is that a vaccine will not provide permanent immunity. If the length of immunity is very short (e.g. 3 months), then it won’t be the silver bullet we are looking for. I’d be happy to see a year of immunity and ecstatic if it lasts two.

Additionally, there are the side effects. We’ll have to see what the results are from this trial, but in the phase II trial, something like 8% or 17% of subjects (I’m unsure of the dosage for the phase III) experienced a fever after their booster. It is likely that you’ll want to take the day after you get the second shot off work in case you don’t feel well. The rate of side effects may harm vaccine uptake.

Categories
Uncategorized

HIV/AIDS Data Distribution Service

This is a public notice that Fellows Statistics is launching a service to provide HIV/AIDS testing sites with better access to their data and statistical products based on their data.

Categories
Uncategorized

Great Infographic

This is a really great exposition on an
infographic. Note that the design elements and “chart junk” serve
to better connect and communicate the data to the viewer. The
choice not to go with pie charts for the first set of plots is a
good one. The drawbacks of polar representations of proportions is
very well know to statisticians, but designers often feel that
circular elements are more pleasing in their infographics. This
bias toward circular representations is sometimes justifiable.
After all, if your graphic is pretty then no one will take the time
to look at it.
Take a look:

inequality

Categories
Uncategorized

R for Dummies

The book R for Dummies was released recently, and was just reviewed by Dirk Eddelbuettel in the Journal of Statistical Software.

Dirk is an R luminary, creating such fantastic works as Rcpp. R for Dummies seems to have beaten Dirk’s natural disinclination to like anything with “for Dummies” appended to it, receiving a pretty positive review. Here is the last bit:

“R for Dummies may well break new ground, and introduce R to new audiences. The pricing is aggressive and should help the book to find its way into the hands of a large number of students, data analysis practitioners as well as researchers. They will find a well-written and easy-to-read introduction to the language and environment – if they can overcome any initial bias against a Dummies title as this reviewer did.”

I haven’t had a chance to read the text, but I have worked (albeit briefly) with Andie de Vries who is one of the authors. He is the author of several R packages up on CRAN, is a regular contributor to the R tag on Stack Overflow, and has a nuanced understanding of the language.

Categories
R Rcpp Uncategorized

Eclipse + Rcpp + RInside = Magic


I’ve been doing R/Java development for some time, creating packages both large and small with this tool chain. I have used Eclipse as my package development environment almost exclusively, but I didn’t realize how much I relied on the IDE before I had to do some serious R/C++ package development. My first Rcpp package (wordcloud) only used a little bit of complied code, so just using a standard text editor was enough to get the job done, however when I went on to a more complex project, TextWrangler just wasn’t cutting it anymore. Where was my code completion? Where were my automatically detected syntax errors?

I found myself spending more time looking up class APIs, fixing stupid errors, and waiting for R CMD INSTALL to finish than I did coding. Unfortunately the internet did not come to the rescue. I searched and searched but couldn’t find anyone who used a modern IDE for package development with compiled code. In particular I wanted the following features.

  • Code completion. What methods does that class have again? What arguments does that function take? Perhaps everyone is just smarter than me, but I can’t seem to keep the whole R/Rcpp API in my head. I just want to hit ctrl+space and see what my options are:

  • Syntax error detection. Oh, I meant hasAttribute. Whoops, forgot that semicolon again.

  • Incremental builds. It takes a long time for R CMD INSTALL to complete. The package that I am currently working on takes 2 minutes and 30 seconds to install. I don’t want to have to wait for a full install every time I make a small change to a function I am playing with.
  • R and C++ syntax highlighting. Editing good looking code makes for a better coding experience.

The solution I found is a combination of Eclipse, Rcpp and RInside. Rcpp is undeniably the best way to embed high performance C++ code within R. It makes writing C++ code with native R objects a breeze. Even John Chambers is unhappy with the lack of elegance in the R/C interface. Rcpp uses some of the more advanced language features in C++ to abstract away all of the ugliness. RInside on the other hand embeds R within a C++ program.

The steps below will show you how to link up Eclipse with Rcpp to get code completion and syntax error detection, then RInside will be used to link up R with Eclipses build and run systems allowing for incremental building and rapid prototyping.


Step 1: Download Eclipse


You will need to download the CDT version of eclipse for c/c++ development. It can be obtained at http://www.eclipse.org/cdt/.


Step 2: Install statet


statet is an eclipse plug-in supporting R integration. Follow the installation instructions at http://www.walware.de/goto/statet. R will need to be configured, which is covered in section 3 of Longhow Lam’s user guide.


Step 3: Install Rcpp and Rinside


In R run:

install.packages(c("Rcpp","RInside"),type="source")


Step 4: Create a skeleton for a new C++ project


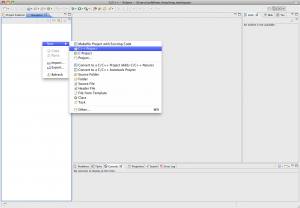
  • Right click on the Navigator area and select New -> C++ Project.

  • Name the project MyCppPackage and click Finish.

  • In R create a cpp package skeleton with the following code:
library(Rcpp)
Rcpp.package.skeleton("MyCppPackage")


  • In the file system navigate to your R working directory. There you should find a new folder labeled MyCppPackage. Drag the contents of that folder into your project in eclipse.

Step 5: Making the package installable


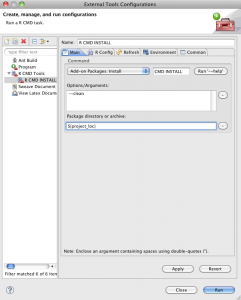
Open the external tools configurations and create a new statet R CMD Tools configuration for R CMD INSTALL. Change the directory from resource_loc to project_loc. Note, you will probably want to also add the command line argument “–clean” so that temporary files created during the install process are removed. If you want the fastest possible installation, use “–no-test-load –no-multiarch –clean”.


Your shiny new Rcpp project should now be installable with the click of a button. Run the configuration (you should an install log in the console) and check that the package is now loadable by running library(MyRcppPackage) in R.

Step 6: Setting up links and properties


Now eclipse knows how to install the package, but it doesn’t know what any of the symbols in your C++ files mean because it can’t see the Rcpp package. If you look at the rcpp_hello_world.cpp file you should see a bunch of bugs.
In this step we will set up the project properties necessary for Eclipse to link up with R, Rcpp and RInside. There may be a few things that you need to change for your system. Notably, the directories listed below all start with /Library/Frameworks/R.framework/Resources. This is the default R_HOME for Mac OS X. If your R home is located in a different place, or you have a user library directory where Rcpp and RInside are installed, you will need to edit the directories accordingly. Also, the architecture for my R is x86_64, so if your architecture is different, you will need to change this.
  • Right click on MyCppPackage and select properties.
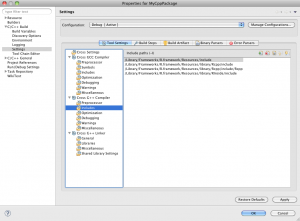
  • Add references to the header files for R, Rcpp and RInside to the G++ compiler includes.
/Library/Frameworks/R.framework/Resources/include
/Library/Frameworks/R.framework/Resources/library/Rcpp/include
/Library/Frameworks/R.framework/Resources/library/RInside/include
(note: these may be different on your system depending on your R_HOME and library paths)
(edit: I’ve removed the include directive for the /Rcpp/include/Rcpp directory as it is not needed and can lead to conflicting references for string.h on case-insensitive operating systems).

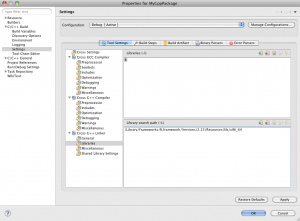
  • Add a reference to the R library to G++ linker – Libraries.
/Library/Frameworks/R.framework/Resources/lib/x86_64
(note: if you are not using the x86_64 arch, replace this with the appropriate architecture.)
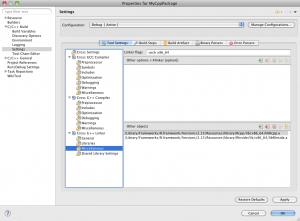
  • Add linkages for the RInside library to the G++ linker – Miscellaneous
/Library/Frameworks/R.framework/Resources/library/RInside/lib/x86_64/libRInside.a


(edit: I’ve removed the reference to Rcpp/lib/x86_64/libRcpp.a as Rcpp is header only (as of 0.11.0))

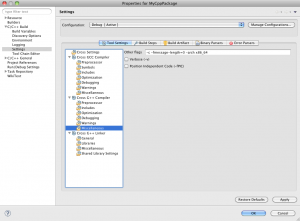
  • Add the “-arch x86_64” architecture flag for g++ compiler. This option is found in the Miscellaneous settings. If your computer’s architecture is different, set the flag accordingly.

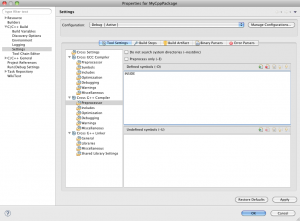
  • Set the g++ Compiler – Preprocessor symbol INSIDE. This is used in the main.cpp file in the next section.


Step 7: Enabling building and launching

  • Create a new c++ file main.cpp in the src folder with the following code
#ifdef INSIDE
#include <Rcpp.h>
#include <RInside.h>                    // for the embedded R via RInside
#include "rcpp_hello_world.h"
using namespace Rcpp;
using namespace std;
int main(int argc, char *argv[]) {
    RInside R(argc, argv);              // create an embedded R instance
    SEXP s = rcpp_hello_world();
    Language call("print",s);
    call.eval();
    return 0;
}
#endif


  • Execute Project – “Build All”. You should see the project building in the eclipse console, ending with **** Build Finished ****.
  • Next, go to Run – “Run Configurations”.

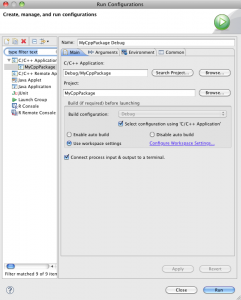
  • Create a new C++ run configuration set to launch the binary Debug/MyCppPackage

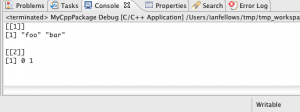
  • Hit run. You should then see the binary building and running. The output of main.cpp will be emitted into the Eclipse console. This allows you to do rapid prototyping of c++ functions even if they require the full functionality of R/Rcpp.

You can also make use of Eclipse’s extensive and very useful code sense to both detect errors in your code, and to assist in finding functions and methods. ctrl+space will trigger code completion


Final thoughts


Rcpp has made R package development with C++ code orders of magnitude easier than earlier APIs. However, without the features modern IDE, the developers life is made much harder. Perhaps all the old school kids with Emacs/ESS have trained their brains to not need the features I outlined above, but I am certainly not that cool. I found that I was at least 4-5 times more productive with the full Eclipse set-up as I was prior.

After following the steps above, you should have a template project all set up with Eclipse and are ready build it out into your own custom Rcpp based package. These steps are based on what worked for me, so your milage may vary. If you have experiences, tips, suggestions or corrections, please feel free to post them in the comments. I will update the post with any relevant changes that come up.

Update: Windows users may find this SO helpful 

————————————–


Fellows Statistics provides experienced, professional statistical advice and analysis for the corporate and academic worlds.


Categories
Deducer JGR R Uncategorized Video

Reading Excel data is easy with JGR and XLConnect

Despite the fact that Excel is the most widespread application for data manipulation and (perhaps) analysis, R’s support for the xls and xlsx file formats has left a lot to be desired. Fortunately, the XLConnect package has been created to fill this void, and now JGR 1.7-8 includes integration with XLConnect package to load .xls and .xlsx documents into R.

Not fancy, but very useful.

Categories
R Uncategorized

Normality tests don’t do what you think they do

Last week a question came up on Stack Overflow about determining whether a variable is distributed normally. Some of the answers reminded me of a common and pervasive misconception about how to apply tests against normality. I felt the topic was general enough to reproduce my comments here (with minor edits).

Misconception: If your statistical analysis requires normality, it is a good idea to use a preliminary hypothesis test to screen for departures from normality.

Shapiro’s test, Anderson Darling, and others are null hypothesis tests against the the assumption of normality. These should not be used to determine whether to use normal theory statistical procedures. In fact they are of virtually no value to the data analyst. Under what conditions are we interested in rejecting the null hypothesis that the data are normally distributed? I, personally, have never come across a situation where a normal test is the right thing to do. The problem is that when the sample size is small, even big departures from normality are not detected, and when your sample size is large, even the smallest deviation from normality will lead to a rejected null.

Let’s look at a small sample example:

> set.seed(100)
> x <- rbinom(15,5,.6)
> shapiro.test(x)

Shapiro-Wilk normality test

data: x
W = 0.8816, p-value = 0.0502

> x <- rlnorm(20,0,.4)
> shapiro.test(x)

Shapiro-Wilk normality test

data: x
W = 0.9405, p-value = 0.2453

In both these cases (binomial and lognormal variates) the p-value is > 0.05 causing a failure to reject the null (that the data are normal). Does this mean we are to conclude that the data are normal? (hint: the answer is no). Failure to reject is not the same thing as accepting. This is hypothesis testing 101.

But what about larger sample sizes? Let’s take the case where there the distribution is very nearly normal.

> library(nortest)
> x <- rt(500000,200)
> ad.test(x)

Anderson-Darling normality test

data: x
A = 1.1003, p-value = 0.006975

> qqnorm(x)
> hist(x,breaks=100)


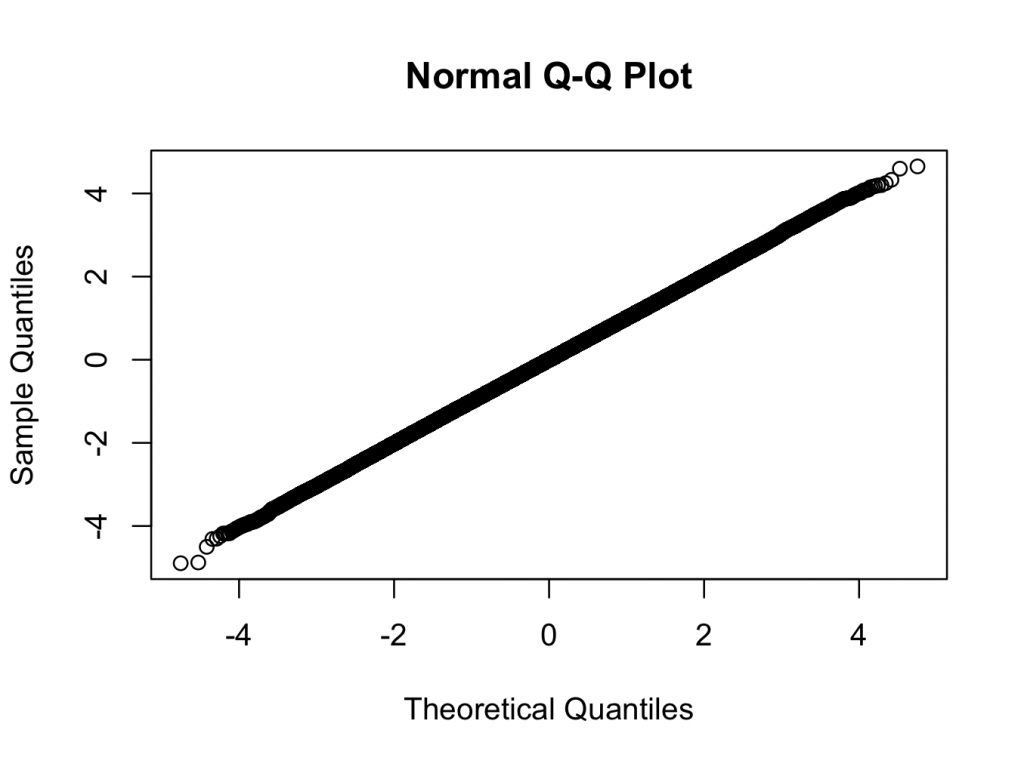
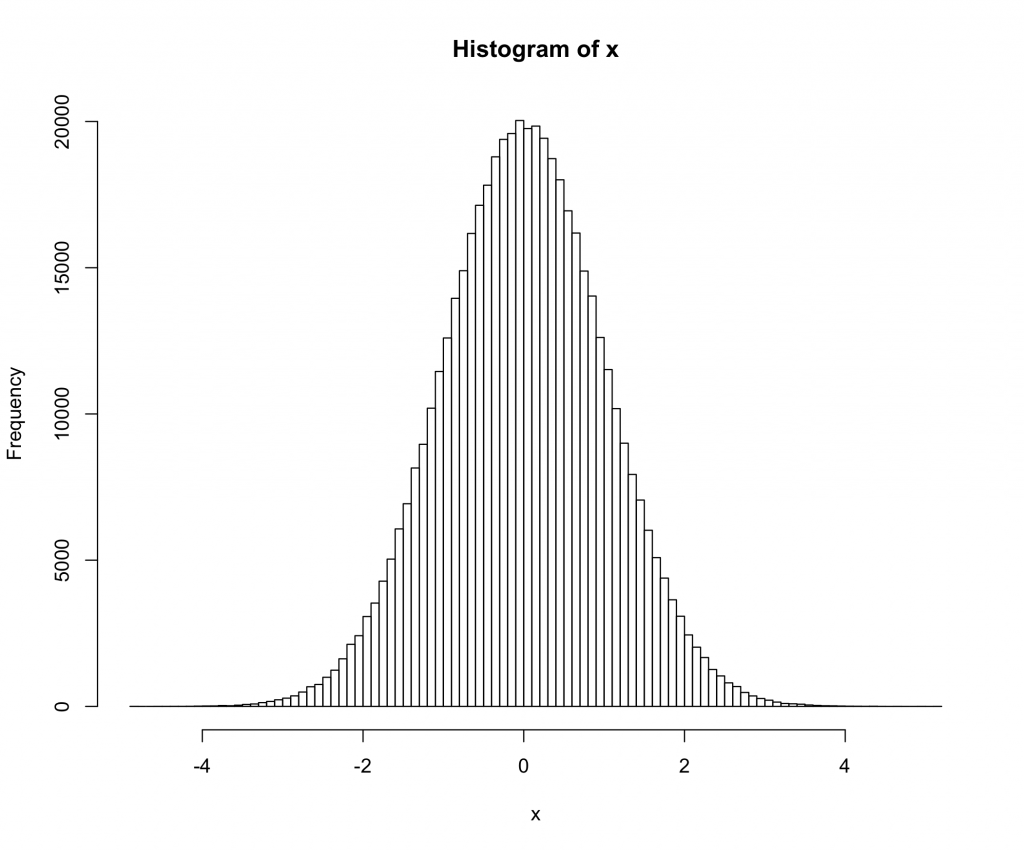
Here we are using a t-distribution with 200 degrees of freedom. The qq and histogram plots show the distribution is closer to normal than any distribution you are likely to see in the real world, but the test rejects normality with a very high degree of confidence.

Does the significant test against normality mean that we should not use normal theory statistics in this case? (Another hint: the answer is no 🙂 )

Categories
R Uncategorized

Installing rgdal on a Mac

So, installing rgdal, which is an important R package for spatial data analysis can be a bit of a pain on the mac. Here are two ways to make it happen.


The Easy Way
  1. In R run: install.packages(‘rgdal’,repos=”http://www.stats.ox.ac.uk/pub/RWin“)
The Hard Way
  1. Download and install GDAL 1.8 Complete and  PROJ framework v4.7.0-2   from: http://www.kyngchaos.com/software/frameworks%29
  2. Download the latest version of rgdal from CRAN. Currently 0.7-1
  3. Run Terminal.app, and in the same directory as rgdal_0.7-1.tar.gz run:


R CMD INSTALL --configure-args='--with-gdal-config=/Library/Frameworks/GDAL.framework/Programs/gdal-config --with-proj-include=/Library/Frameworks/PROJ.framework/Headers --with-proj-lib=/Library/Frameworks/PROJ.framework/unix/lib' rgdal_0.7-1.tar.gz