A new version of the OpenStreetMap package is now up on CRAN, and should propagate to all the mirrors in the next few days. The primary purpose of the package is to provide high resolution map/satellite imagery for use in your R plots. The package supports base graphics and ggplot2, as well as transformations between spatial coordinate systems.
The bigest change in the new version is the addition of dozens of tile servers, giving the user the option of many different map looks, including those from Bing, MapQuest and Apple.
nm = c("osm", "maptoolkit-topo",
"waze", "mapquest", "mapquest-aerial",
"bing", "stamen-toner", "stamen-terrain",
"stamen-watercolor", "osm-german", "osm-wanderreitkarte",
"mapbox", "esri", "esri-topo",
"nps", "apple-iphoto", "skobbler",
 "opencyclemap", "osm-transport",
"osm-public-transport", "osm-bbike", "osm-bbike-german")

png(width=1200,height=2200)
par(mfrow=c(6,4))
for(i in 1:length(nm)){
	print(nm[i])
	map = openmap(c(lat= 38.05025395161289,   lon= -123.03314208984375),
			c(lat= 36.36822190085111,   lon= -120.69580078125),
			minNumTiles=9,type=nm[i])
	plot(map)
	title(nm[i],cex.main=4)
}
dev.off()
 You can also render maps from cloudmade.com which hosts tons of map tilings. Simply set the “type” parameter to “cloudmade-<id>” where <id> is the cloudmade identifier for the map you want to use. Here is a sample:
nm = c("cloudmade-2","cloudmade-999","cloudmade-998",
"cloudmade-7","cloudmade-1960","cloudmade-1155",
"cloudmade-12284")
#setCloudMadeKey("<your key>")
png("RPlot002.png",width=1300,height=800)
par(mfrow=c(2,4))
for(i in 1:length(nm)){
	print(nm[i])
	map = openmap(c(lat= 38.05025395161289,   lon= -123.03314208984375),
			c(lat= 36.36822190085111,   lon= -120.69580078125),
			minNumTiles=9,type=nm[i])
	plot(map)
	title(nm[i],cex.main=4)
}
dev.off()
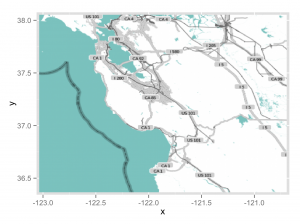
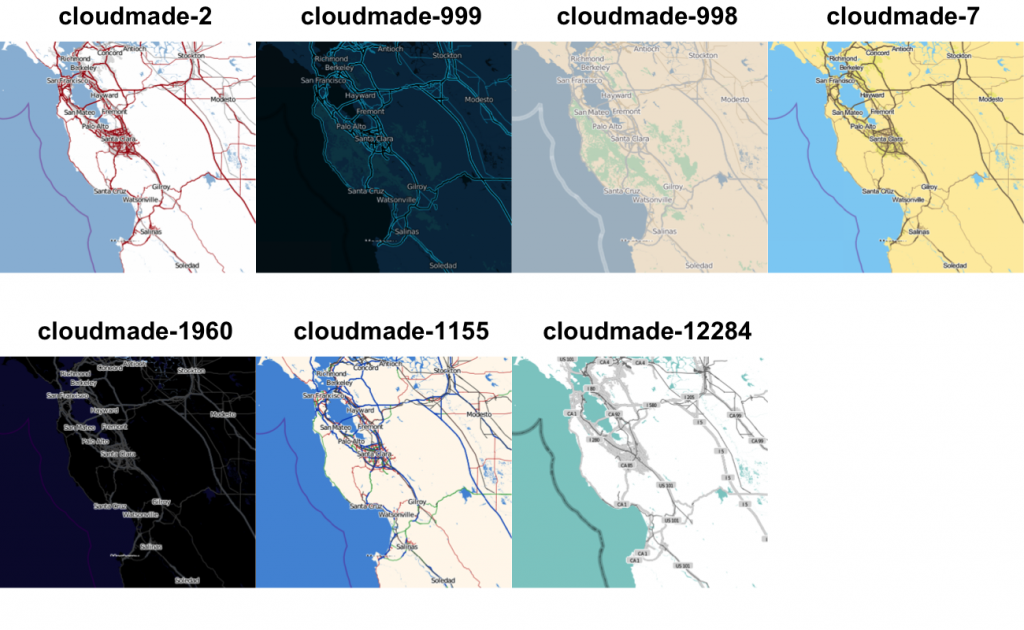 Maps are initially put in a sperical mercator projection which is the standard for most (all?) map tiling systems, but can easily be translated to long-lat (or any other projection) using the openproj function. Maps can be plotted in ggplot2 using the autoplot function.
mapLatLon = openproj(map)
autoplot(mapLatLon)
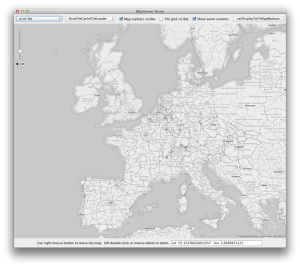
 The package also has a Java GUI to help with map type selection, and specification of coordinates to bound your map. clicking on the map will give you the latitude and longitude of the point clicked.
launchMapHelper()
Probably the main alternative to OpenStreetMap is the ggmap package. ggmap is an excellent package, and it is somewhat unfortunate that there is a significant duplication of effort between it and OpenStreetMap. That said, there are some differences that may help you decide which to use:
Reasons to favor OpenStreetMap:
- More maps: OpenStreetMap supports more map types.
- Better image resolution: ggmap only fetches one png from the server, and thus is limited to the resolution of that png, whereas OpenStreetMap can download many map tiles and stich them together to get an arbitrarily high image resolution.
- Transformations: OpenStreetMap can be used with any map coordinate system, whereas ggmap is limited to long-lat.
- Base graphics: Both packages support ggplot2, but OpenStreetMap also supports base graphics.
- No Java dependency: ggmap does not require Java to be installed.
- Geocoding: ggmap has functions to do reverse geo coding.
- Google maps: While OpenStreetMap has more map types, it currently does not support google maps.
