I’m usually quite a big fan of the content syndicated on R-Bloggers (as this post is), but I came across a post yesterday that was as statistically misguided as it was provocative. In this post, entitled “The Surprisingly Weak Case for Global Warming,” the author (Matt Asher) claims that the trend toward hotter average global temperatures over the last 130 years is not distinguishable from statistical noise. He goes on to conclude that “there is no reason to doubt our default explaination of GW2 (Global Warming) – that it is the result of random, undirected changes over time.”
These are very provocative claims which are at odds with the vast majority of the extensive literature on the subject. So this extraordinary claim should have a pretty compelling analysis behind it, right?…
Unfortunately that is not the case. All of the author’s conclusions are perfectly consistant with applying an unreasonable model, inappropriate to the data. This in turn leads him to rediscover regression to the mean. Note that I am not a climatologist (neither is he), so I have little relevant to say about global warming per se, rather this post will focus on how statistical methodologies should pay careful attention to whether the data generation process assumed is a reasonable one, and how model misspecification can lead to professional embarrassment.
His Analysis
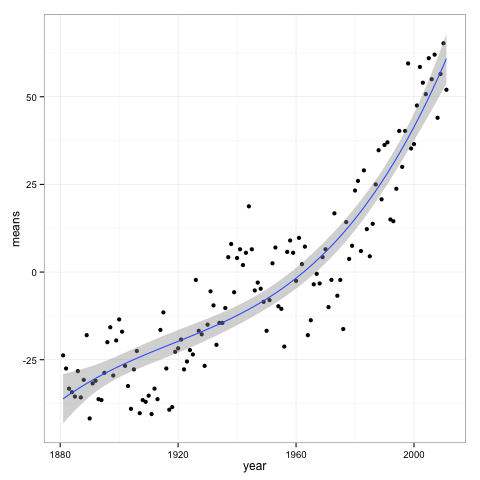
First, let’s review his methodology. He looked at the global temperature data available from NASA. It looks like this:
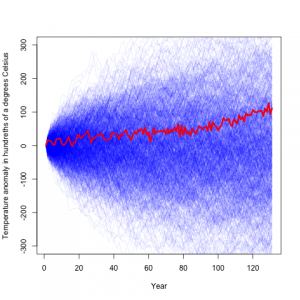
He then assumed that the year to year changes are independent, and simulated from that model, which yielded:
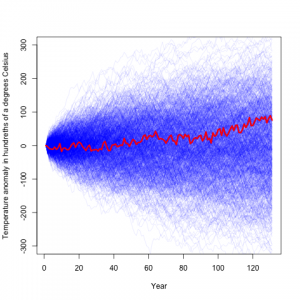 Here the blue lines are temperature difference records simulated from his model, and the red is the actual record. From this he concludes that the climate record is rather typical, and consistant with random noise.
A bit of a fly in the ointment though is that he found that his independence assumption does not hold. In fact he finds a negative correlation between one years temperature anomaly and the next:
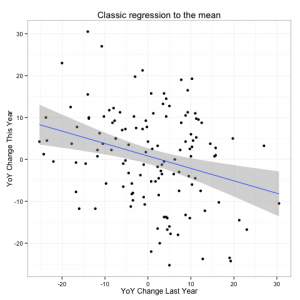 Any statistician worth his salt (and indeed several of the commenters noted) that this looks quite similar to what you would see if there were an unaccounted for trend leading to a regression to the mean.
Bad Model -> Bad Result
The problem with using an autoregressive model here is that it is not just last year’s temperatures which determine this year’s temperatures. Rather, it would seem to me as a non-expert, that temperatures from one year are not the driving force for temperatures for the next year (as an autoregressive model assumes). Rather there are underlying planetary constants (albedo and such) that give a baseline for what the temperature should be, and there is some random variation which cause some years to be a bit hotter, and some cooler.
Remember that first plot, the one with the cubic regression line. Let’s assume that data generation process is from that regression line, with the same variance of residuals. We can then simulate from the model to create an fictitious temperature record. The advantage of doing this is that we know the process that generated this data, and know that there exists a strong underlying trend over time.
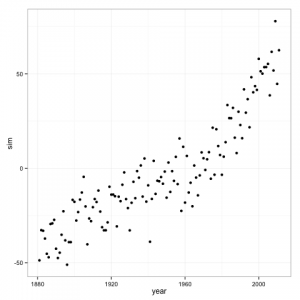
If we fit a cubic regression model to the data, which is the correct model for our simulated data generation process, it shows a highly significant trend.
              Sum Sq  Df F value    Pr(>F)
poly(year, 3)  91700   3  303.35 < 2.2e-16 ***
Residuals      12797 127
We know that this p-value (essentially 0) is correct because the model is the same as the one generating the data, but if we apply Mr. Asher’s model to the data we get something very different.
His model finds a non-significant p-value of .49. We can also see the regression to the mean in his model with this simulated data.
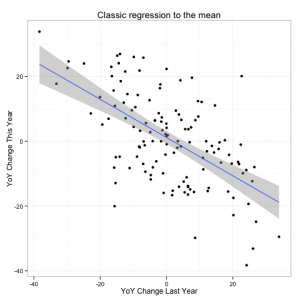
So, despite the fact that, after you adjust for the trend line, our simulated data is generating independent draws from a normal distribution, we see a negative auto-correlation in Mr. Asher’s model due to model misspecification.
Final Thoughts
What we have shown is that the model proposed by Mr. Asher to “disprove” the theory of global warming is likely misspecified. It fails to to detect the highly significant trend that was present in our simulated data. Furthermore, if he is to call himself a statistician, he should have known exactly what was going on because regression to the mean is a fundamental 100 year old concept.
———————-
The data/code to reproduce this analysis are available here.
18 replies on “Climate: Misspecified”
Your assertion on my blog post:
“Your methods will find no trend in even the strongest cases”
is incorrect. I posted sample code here: http://www.statisticsblog.com/2012/12/the-surprisingly-weak-case-for-global-warming/comment-page-1/#comment-16404
I explained why this wasn’t regression to the mean in the post and in one of the comments below the post.
Also, I didn’t propose the model to “‘disprove’ the theory of global warming,” which is really a series of related claims (did you read the piece?).
If your data are generated from an ARMA process, then yes, you can detect trends because you have the right null hypothesis. If the process is deviations from a mean trend, then you will not. Further, you will see diagnostics exactly like those that you saw in the actual climate data.
You made quite a lot of overreaching claims in your post, one of which I quote at the beginning of this post, indicating that you see no reason to believe the theory of global warming.
There is autocorrelation in the climate record. Yearly and quasi periodic perhaps related to sunspot (solar radiance) and El Nino. But it’s difficult to think how the atmospheric chemistry that we do understand could lead to a simple random walk. It’s also difficult to explain why the temperature remained quite stable about a mean for a long time prior to the last ~120 years and then went on a wander. Anyway this has been discussed before…
http://www.realclimate.org/index.php/archives/2005/12/naturally-trendy/
To quote from the above link:
“When ARIMA-type models are calibrated on empirical data to provide a null-distribution which is used to test the same data, then the design of the test is likely to be seriously flawed. To re-iterate, since the question is whether the observed trend is significant or not, we cannot derive a null-distribution using statistical models trained on the same data that contain the trend we want to assess”
Also some autocorrelation is caused by big volcanic eruptions; Mt. Pinatubo and Mt. St. Helens had real effects on global temperature that didn’t end conveniently on Dec. 31st.
Good post! I was messing around with that data with a similar view of his model… it turns out that if you simulate 2000 years of data, using Matt’s methodology, there’s a 20% chance that the average temperature back then would have been more than +/- 5 degrees C away from today… somehow seems unlikely… how long ago was that last ice age anyway?
I was thinking along the same line, but why only go black 2000 years? Over a million years there would be such wild temp swings life as we know it wouldn’t have happened. So, I don’t think that a random walk is a good model for temp over time.
And the resulting point is simple: climate change is modeled by the biggest supercomputers on the planet. When they’re not being used to model thermonucular explosives. The paleontologists, geologists, paleo-geologists, and climatologists understand the mechanisms of the atmosphere far better than they ever did before because of the more recent (last couple of decades) data availability and fossil/geologic examinations. The models are largely deterministic, with many variables. Which is why they need those supercomputers. Here is a link: http://www.windows2universe.org/earth/climate/cli_models3.html
There are many embedded links on that, and linked, page. Climate modeling isn’t a simple stat equation.
One of the points missing from the original post was any mention of existing statistical climatology results. Didn’t know there was such a thing? Neither did I until I just looked. To avoid problems, I’ll not post any links. But there’s much of it out there.
Dear Matt and Ian
There one thing certain about both your analysis. Both of you don’t know anything about climate science. Why not try neurosurgery as your next hobby.
@Anon: Yeah, and why not?
You know what? Statisticians are able to work with any data, given an educated person to guide the interpretation. You, on the other hand, are doing brain-scans on a dead salmon, are you?
LOL. I like the dead salmon part.
I’m just saying Matt and Ian are making the classical mistake that all statisticians make. That is they get some data and try to analyze it using simple models. Climate models are incredibly complex and can not be interpreted in a simple manner. And remember, that as always “all models are wrong, only some are useful”. In this case, both of these models are not useful.
I must say, I am enjoyed reading both this an Mr Asher’s blog. While this post raises many valid points, I do think you were a bit harsh when saying that “no statistician worth his salt” would perform analysis Mr Asher did. I personally liked Mr Asher’s post and his empirical bootstrap approach. I would have to look a little more deeply into his exact methodology before I make my own conclusions about validity. At first blush, however, it does seem okay based on the IMPLICIT ASSUMPTIONS HE MADE (one being that all of the information pertinent to the analysis is contained within the time series itself).
What I think is more important than his assumptions or even the specification of his model, is the point (which he makes indirectly), is that the popular media does not report on the possible uncertainties surrounding climate models. While I am no climatologist, I guess that climate models are quite sensitive to initial conditions? It would be interesting to hear from an expert how certain we truly are about climate model predictions.
As a last point, I think few people truly deny that we are experiencing global warming (GW). It is more a matter of how great humankind’s influence is on GW and whether the cost of carbon-offsetting is justified (especially for developing economies). If this is simply a natural cycle, should our focus not be adaptation? Again, Mr Asher insightfully alluded to many of these points.
I think you and Matt have done the area a great service by challenging us to look at the underlying raw data and check the inferences that have been made and upon which billions of dollars have been spent. The data itself can be downloaded and analysed with the RghcnV3 package. My assertion is that a global average temperature based on this data is meaningless and the models based on such a concept are little better – especially when there is no good cross validation or predictive performance. The “vast majority” after all believed that the sun went round the flat earth
I think you are wrong on one point Ian.
“The problem with using an autoregressive model”
Matt is not using an auto-regressive model – he is using one with -ve autocorrelation. In other words he is using MA, not AR.
The negative correlation between one year’s change and the next is more indicative of an MA process, not an AR one. (Matt, have I got this right?)
Hi Ian,
I do like the post, thanks. In fact, as I’m sure many others, I only skimmed through the original one and as I know this subject is controversial, felt a false sense of comfort adding this piece of “against GW” evidence into the mix.
Your post reminded me how dangerous it is to establish an opinion based solely on “browsing”. More so in this Internet age where anyone is responsible for its own work.
I suggest an update to your post sharpening the focus towards this important point and less on the GW issue where we can all agree no one here is an expert on the subject. I believe that was your original intent, not to discuss GW or to belittle anyone.
Thank you for the thoughtful commentary.
@Stephan: I did see the autocorrelation. The linked to code does a durbin-watson test and finds significant auto correlation adjusting for the trend line. From the link you posted, it seems like the use of random walk is one of those zombie ideas.
@anon: I feel the need to clarify that I am _not_ creating a climate model in this post. As some of the other commenters pointed out, I would want to do a _lot_ of lit review before I attempted that. The point here is to underscore the importance of understanding the data generation process. Just because you can write down a stochastic model does not mean that it is applicable to the situation. To do this I simulated from a known stochastic process with a very strong trend but is not a random walk. The result is that the random walk method fails to detect the trend, and gives diagnostic results similar to what were reported for the climate data.
@hmmmm: the ar(1) model is X_t = X_{t-1} + e_t where e_t is random noise. This the changes are independent random noise. The bootstrap procedure outlined has this as it’s null distribution (robust to non-normality of e_i).
To avoid the controversial of climate change, let’s pretend this time series is a price series for some stock (equity).
People do apply bootstrapping to such finanical time series.
If there’s autocorrelation of returns (period-to-period changes) then one “fix”
that I’ve seen is to bootstrap blocks of time greater than the period over which autocorrelation exists.
Matt Asher did that as well:
“The most straightforward way to incorporate this correlation into our simulation is to sample YoY changes in 2-year increments.”
My question is:
How do we know using statistical tests that there’s model mis-specification in a model of a time series?
For the climate time series there’s a lot of extra physical background that analysts/modellers know or think they know.
But if we eliminate that extra knowledge and consider a time series in isolation, then how is model mis-specification detected?
An AR(1) model would be X_t = alpha X_{t-1} + e_t where alpha is a parameter,
and the model is really autoregressive in the sense of reverting to the mean if alpha < 1.
Franzske has written papers on this using climate data.