This is a quick note on profiling your compiled code on the mac. It is important not to guess when figuring out where the bottlenecks in your code are, and for this reason, the R manual has several suggestions on how to profile compiled code running within R. All of the methods are platform dependent, with linux requiring command line tools (sprof, and oprofile). On the mac there are some convenient GUI tools built in to help you out.
Our test code is drawn from the ergm package, and fits a network model to a small graph. This model is fit using markov chain monte carlo, so we expect most of the time to be spent drawing MCMC samples.
library(ergm)
flomarriage = network(flo,directed=FALSE)
flomarriage %v% "wealth" = c(10,36,27,146,55,44,20,8,42,103,48,49,10,48,32,3)
for(i in 1:10) gest = ergm(flomarriage ~ kstar(1:2) + absdiff("wealth") + triangle)
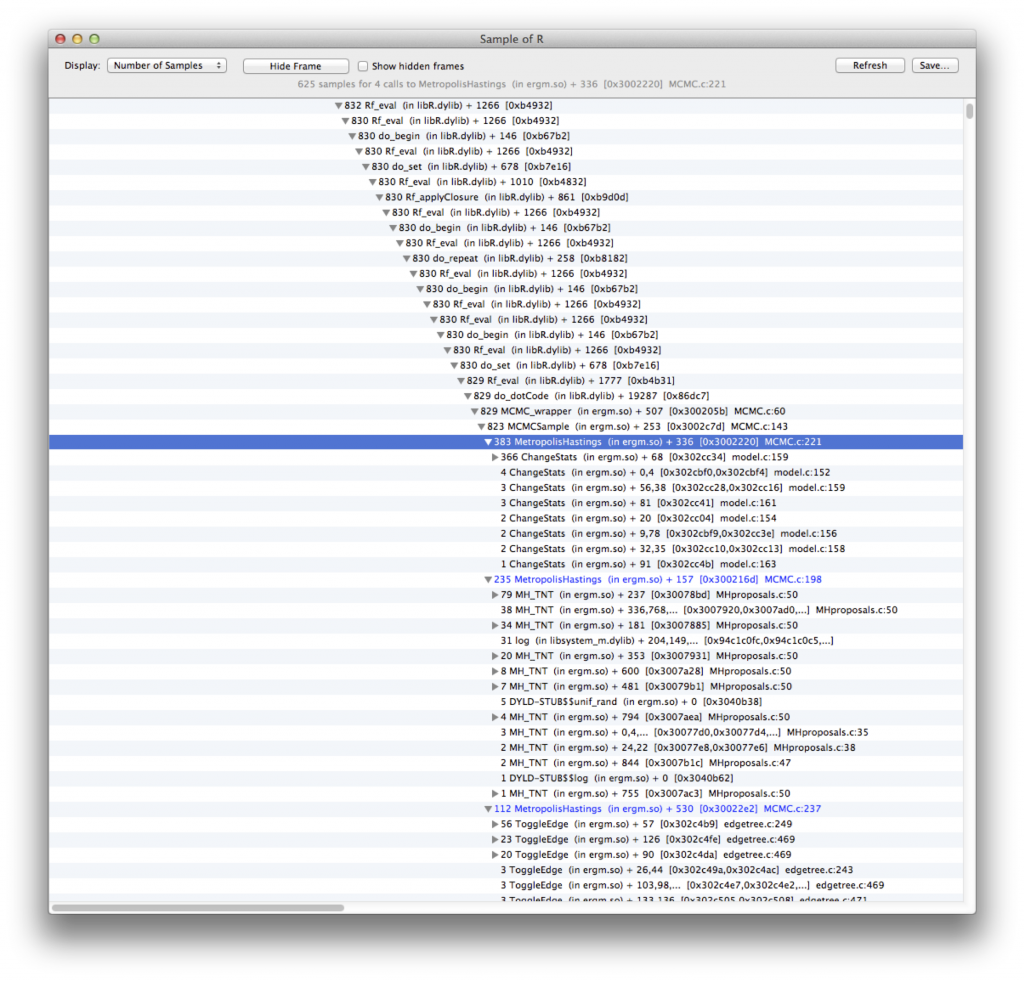
The quickest way to get an idea of where your program is spending time is to open Activity Monitor.app and select the R process while the above code is running. Then click sample, which should result in something like:
 In order to get down to the interesting code, you’ll have to wade though a bunch of recursive Rf_eval and do_begin calls used by R. Finally though we see the MCMCSample function in ergm.so which contains almost all of the samples. So it is as we expected, the MCMC sampling takes up all the time. Underneeth that we see calls to:
- ChangeStats: calculates the network statistics
- MH_TNT: calculates the metropolis proposal
- ToggleEdge: alters the network to add (or remove) an edge
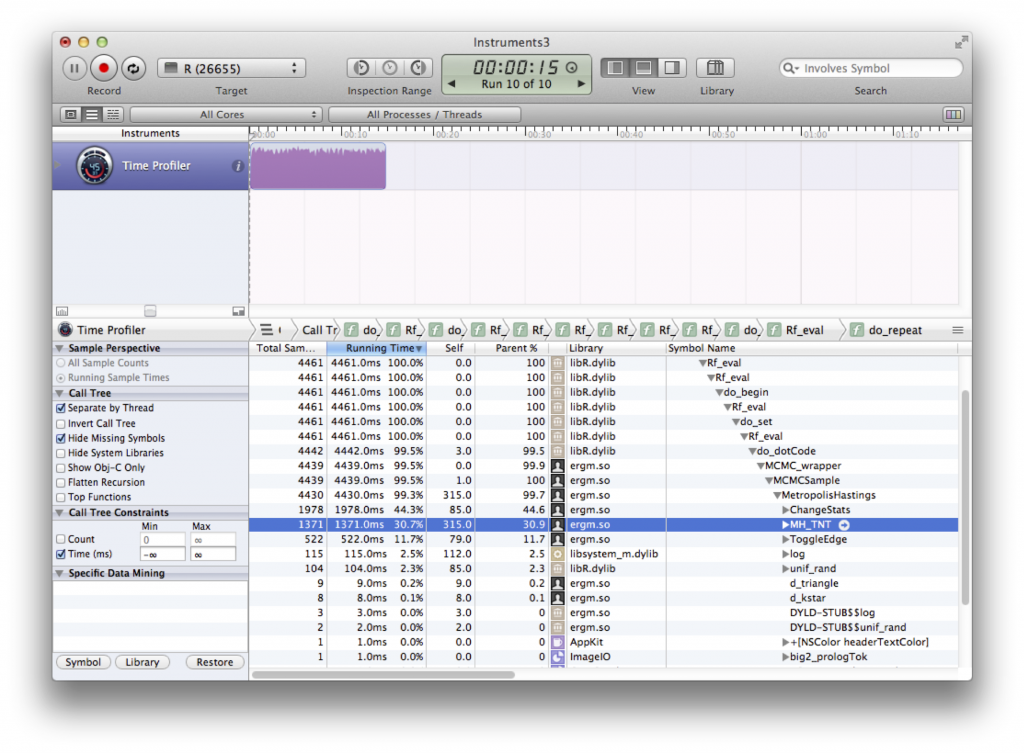
But how much these contribute is a bit difficult to see here. Enter the Time Profiler in Instruments.app. You can launch this program from within Xcode.app under Xcode – Open Developer Tool – Instruments. Once Instruments is open, click Library and drag the Time Profiler into the program. Then, while the R code is running, select ‘Attach to Process’ – R and click record. You should get something like:
 Like in the Activity Monitor, we have to drill down past all of the recursive Rf_eval calls, but once we do, we see that ChangeStats is taking 44.6% of the time, MH_TNT takes 30.9% and ToggleEdges takes 11.7%. We could further expand these out to identify possible targets for optimization within each of these functions.
So there you have it. Apple makes it really easy to profile your compiled code. One issue that I ran into is to make sure that your Xcode is up-to-date and that Instruments is version 4.0 or above. I experienced some crashes profiling R with older versions.