A new package OpenStreetMap has been released to CRAN this week which is designed to allow you to easily add satellite imagery, or open street maps to your plots. Raster maps are a great way to add context to your spatial data with a minimum outlay of effort.
The syntax in OpenStreetMap is fairly simple, just give it a bounding box in lat/long and it will download a high quality raster image ready for plotting
library(OpenStreetMap)

library(rgdal)

map plot(map)
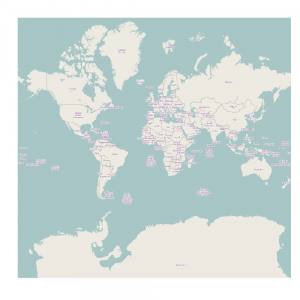
(click for higher quality image)
The above code downloads multiple map tiles and stitches together, with the level of zoom determined automatically. Unlike RGoogleMaps no files are created or stored on the hard drive. The plot gets is images from the mapnik server, which can provide street level information. In my opinion, there rendering looks pretty clean as well.
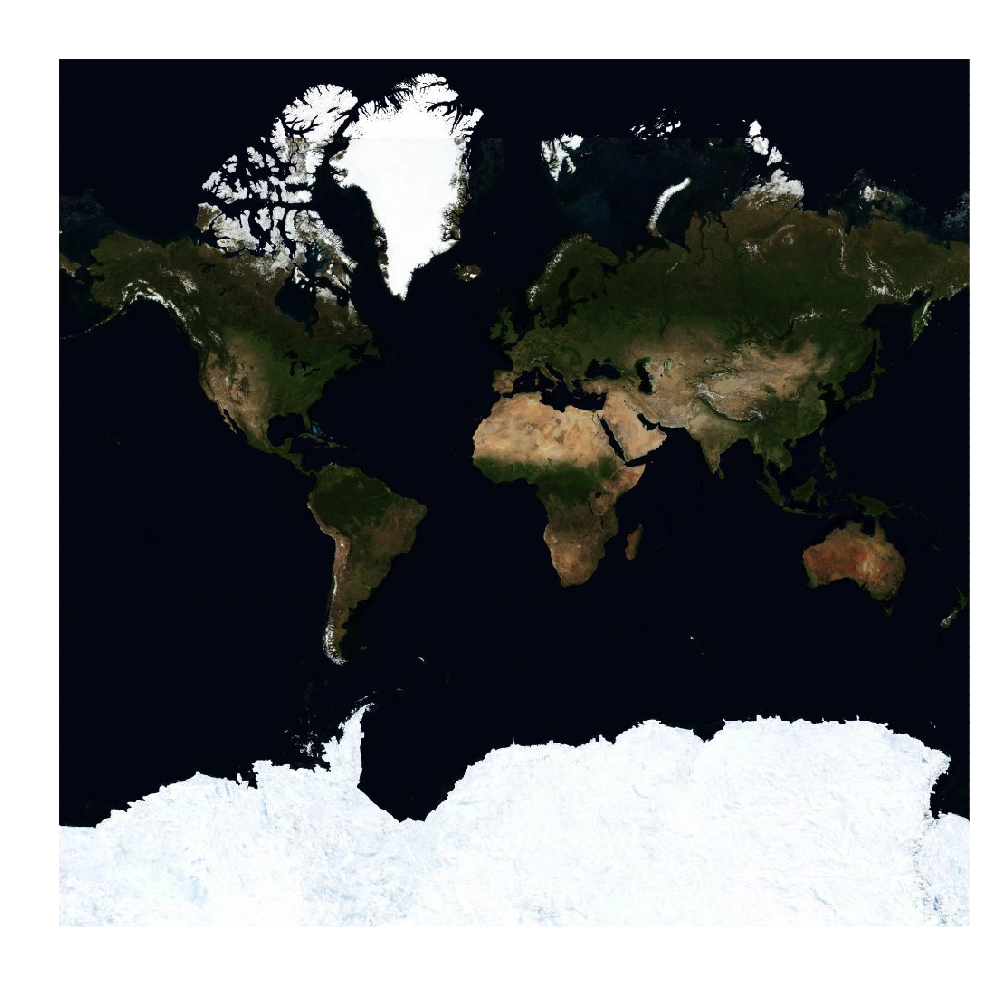
We can also access satellite imagery though Bing.
map plot(map)
Now, that is all fine and dandy, but kind of useless unless you are able to combine it with your own data. Open street map, and Bing (and Google maps) use a particular form of the Mercator projection which has the properties that angles are preserved, and tiles on multiple zoom levels can be stitched together. You can access this projection with the ‘osm’ function.
In terms of combining maps with your data there are two options. The data can be transformed to the osm() projection, or the raster map can be translated to whatever projection the data are in. Here is an example of the first option:
library(UScensus2000)

data(california.tract)

lat lon southwest california.tract plot(southwest)

plot(california.tract,add=TRUE,col=(california.tract@data$med.age>40)+4)
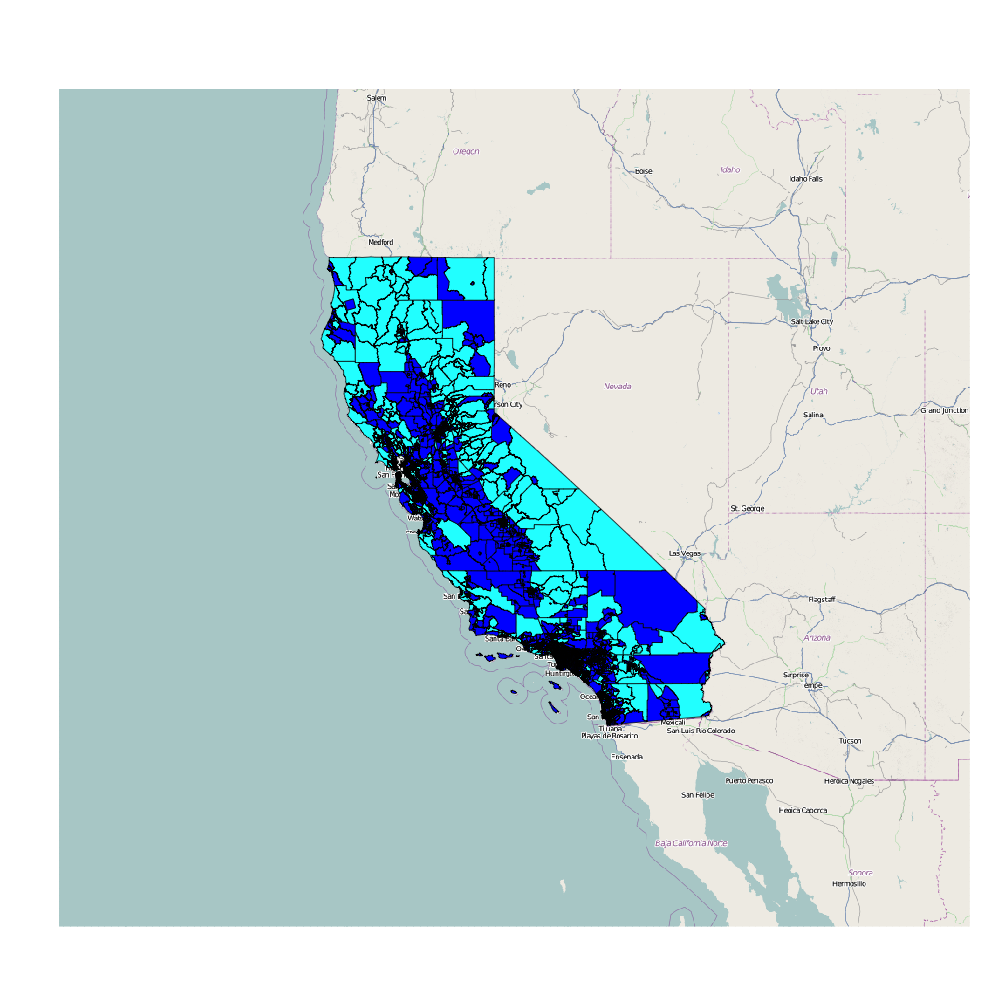
Here we take a map from the UScensus2000 package, transform it to mercator coordinates, and make a choropleth. The spTransform function is a great easy way to project your data into different map coordinate systems.
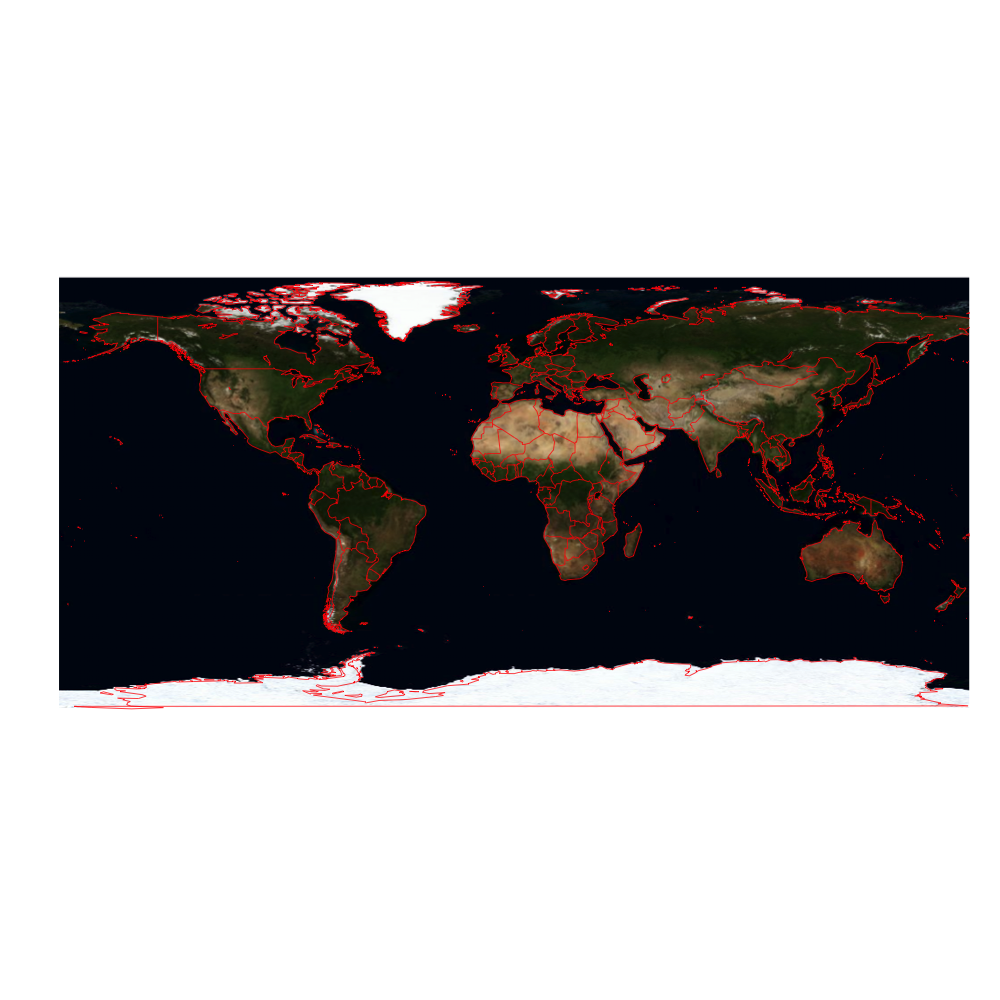
We may also want to go the other way and transform the image. The openproj function can transform open street maps to different projections. Here is an example combining OpenStreetMap with the maps library by projecting the map into longlat coordinates.
map map_longlat plot(map_longlat,raster=TRUE)

map("world",col="red",add=TRUE)
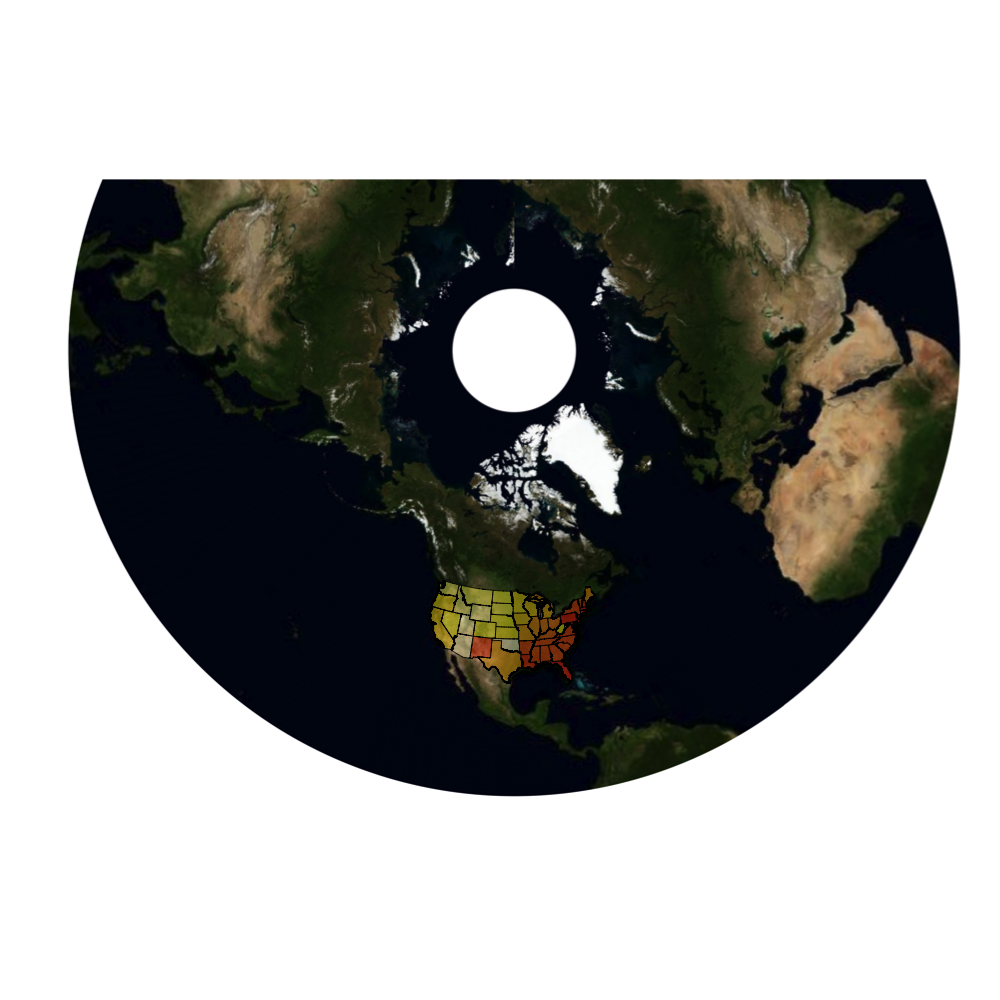
but, we are not just limited to the longlat projection, we can also do weirder ones like the lambert conic conformal.
map c(40,179),zoom=2,type='bing')

map_longlat #Lambert Conic Conformal (takes some time...)

map_llc "+proj=lcc +lat_1=33 +lat_2=45 +lat_0=39 +lon_0=-96")

plot(map_llc,raster=TRUE)

#add choropleth

data(states)

st_llc plot(st_llc,add=T,col=heat.colors(48,.4)[slot(st_llc,"data")[["ORDER_ADM"]]])
Now, I have no idea why you would want to use this projection, but it is pretty cool none the less.
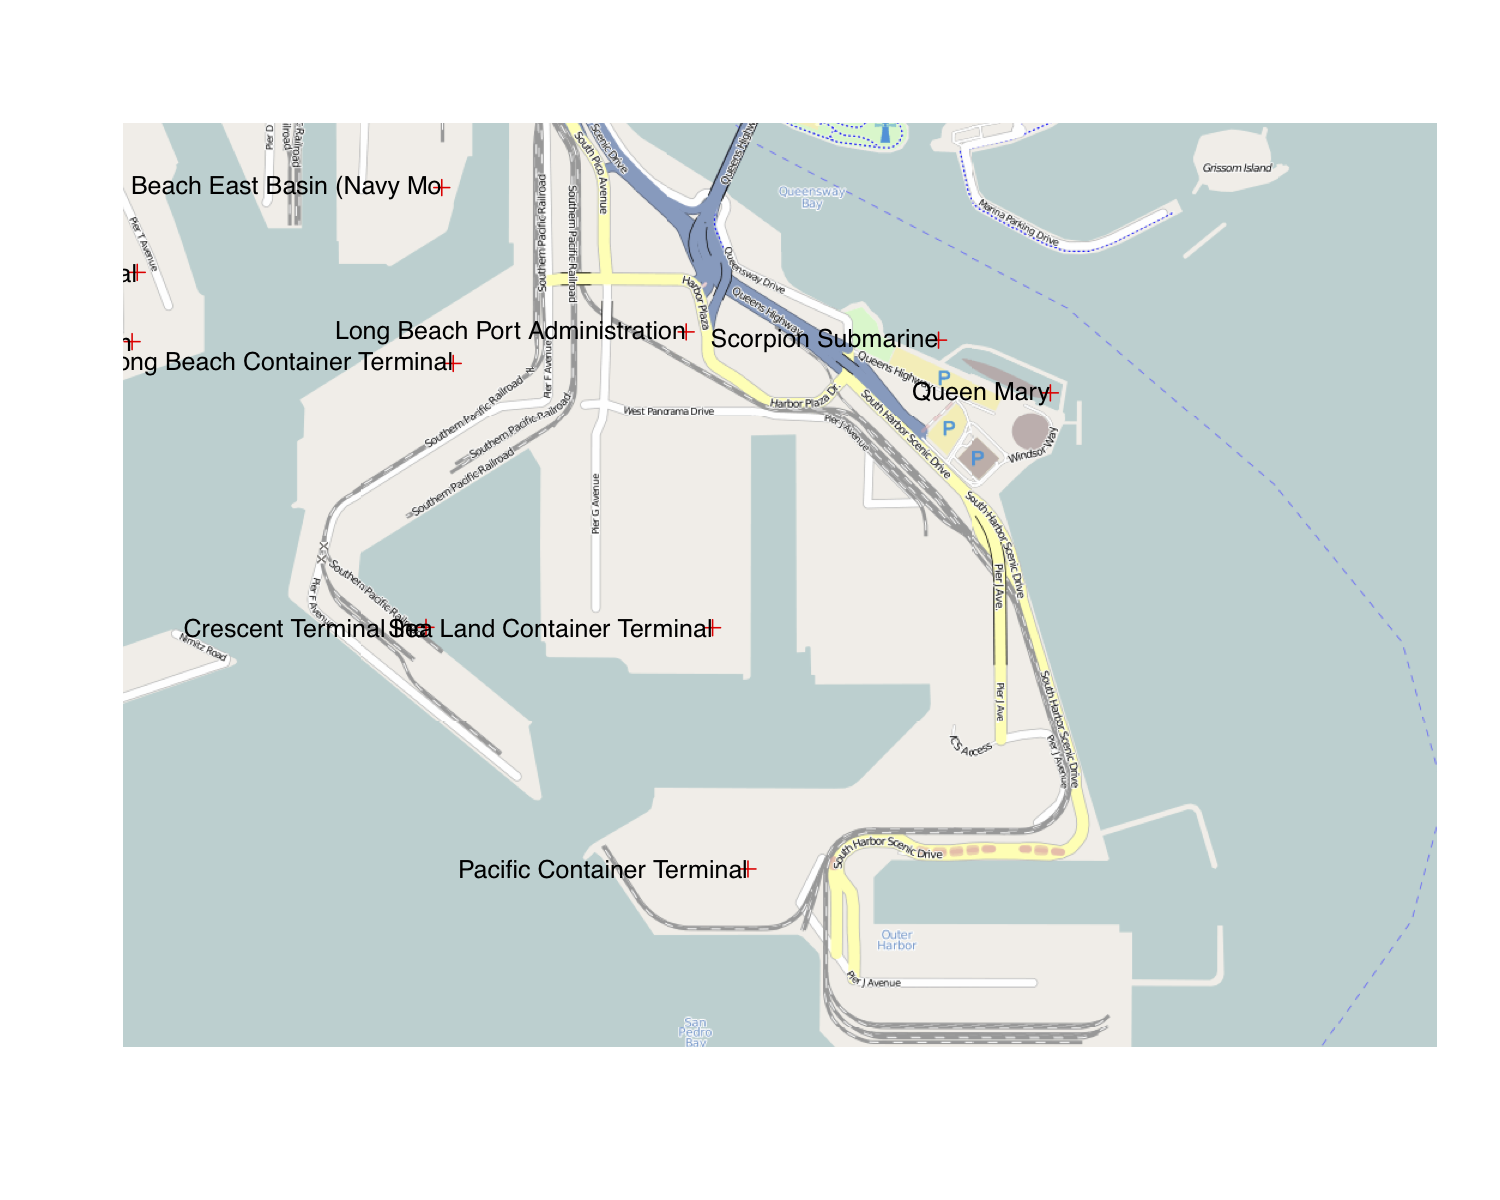
One of the best uses for raster maps is in street level data, where it is particularly important to give the reader contextual information. Here is a plot of some locations in the Long Beach harbor, using the LA_places dataset.
data(LA_places)

xy map c(33.73290566922855,-118.17521095275879))

png(width = 1000, height = 1000)

plot(map,raster=TRUE)

plot(LA_places,add=TRUE,col="red")

text(xy[,1],xy[,2],slot(LA_places,"data")[,'NAME'],adj=1)
If you are a Deducer user, the DeducerSpatial package provides a GUI for spatial plotting using the OpenStreetMap package.
24 replies on “Plot maps like a boss”
Love this article. Your maps are so great!
Very nice article. Could you include rgdal (and other necessary packages) installation instructions? I’m not able to install it correctly, on a mac 🙁
rgdal is pretty easy to install on the mac, just a little non-standard. See: http://blog.fellstat.com/?p=46
Thank you. Installed it, but having trouble running the code. Got this error
Error in .jcall(“RJavaTools”, “Ljava/lang/Object;”, “invokeMethod”, cl, :
java.lang.NoClassDefFoundError: Could not initialize class org.openstreetmap.gui.jmapviewer.Tile
and this
Error in plot(map) :
error in evaluating the argument ‘x’ in selecting a method for function ‘plot’: Error: object ‘map’ not found
A few things to try. First, make sure all your packages are up to date with update.packages() . Next, OpenStreetMap is a java based package, so make sure you have java installed and it is working with R CMD javareconf executed in the terminal. If that doesn’t work, report back with the results from R CMD javareconf, and sessionInfo() (in R after loading OpenStreetMap).
Thank you for the instructions. Java is installed and both java/javac are working. This is the result of sessionInfo(). Still getting the same errors as above
> update.packages()
> sessionInfo()
R version 2.14.2 (2012-02-29)
Platform: x86_64-apple-darwin9.8.0/x86_64 (64-bit)
locale:
[1] en_US.UTF-8/en_US.UTF-8/en_US.UTF-8/C/en_US.UTF-8/en_US.UTF-8
attached base packages:
[1] stats graphics grDevices utils datasets methods base
loaded via a namespace (and not attached):
[1] colorspace_1.1-1 dichromat_1.2-4 digest_0.5.1 ggplot2_0.9.0
[5] grid_2.14.2 MASS_7.3-17 memoise_0.1 munsell_0.3
[9] plyr_1.7.1 proto_0.3-9.2 RColorBrewer_1.0-5 reshape2_1.2.1
[13] scales_0.2.0 stringr_0.6 tcltk_2.14.2 tools_2.14.2
Also tried this. Should I downgrade R to 2.14.1?
> install.packages(“rgdal”)
Warning message:
In getDependencies(pkgs, dependencies, available, lib) :
package ‘rgdal’ is not available (for R version 2.14.2)
As my per my previous comment, you need to use: install.packages(‘rgdal’,repos=”http://www.stats.ox.ac.uk/pub/RWin”)
Good day,
I get this problem:
2012-03-06 15:50:57.059 rsession[1450:207] Apple AWT Java VM was loaded on first thread — can’t start AWT.
Error in .jcall(“RJavaTools”, “Ljava/lang/Object;”, “invokeMethod”, cl, :
java.lang.InternalError: Can’t start the AWT because Java was started on the first thread. Make sure StartOnFirstThread is not specified in your application’s Info.plist or on the command line
libraries OpenStreetMap, jJava and rgdal load successfully.
That is a bug. I’ve fixed it and it will work in the next release. In the mean time you can use:
Sys.setenv(NOAWT=1) #call this before loading OpenStreetMap
library(OpenStreetMap)
library(rgdal)
map <- openmap(c(70,-179), c(-70,179)) plot(map)
Ok – now it also works for me. Waiting for the next release!
Sorry, was meant to add that I run OS X Lion, R 2.14.2.
Your maps looks great and I’d love to use the package. I have the same error as another poster and I do have rgdal installed.
With your first example I get
library(OpenStreetMap)
library(rgdal)
map <- openmap(c(70,-179), c(-70,179))
Error in .jcall("RJavaTools", "Ljava/lang/Object;", "invokeMethod", cl, :
java.lang.NoClassDefFoundError: Could not initialize class org.openstreetmap.gui.jmapviewer.Tile
sessionInfo()
R version 2.14.2 (2012-02-29)
Platform: x86_64-apple-darwin9.8.0/x86_64 (64-bit)
locale:
[1] en_US.UTF-8/en_US.UTF-8/en_US.UTF-8/C/en_US.UTF-8/en_US.UTF-8
attached base packages:
[1] stats graphics grDevices utils datasets methods base
other attached packages:
[1] ggplot2_0.9.0 maps_2.2-5 rgdal_0.7-8 OpenStreetMap_0.2 raster_1.9-70 maptools_0.8-14 lattice_0.20-0
[8] foreign_0.8-49 sp_0.9-96 rJava_0.9-3
loaded via a namespace (and not attached):
[1] colorspace_1.1-1 dichromat_1.2-4 digest_0.5.1 grid_2.14.2 MASS_7.3-17 memoise_0.1 munsell_0.3
[8] plyr_1.7.1 proto_0.3-9.2 RColorBrewer_1.0-5 reshape2_1.2.1 scales_0.2.0 stringr_0.6 tools_2.14.2
Any other suggestions?
Thanks
You will need to call Sys.setenv(NOAWT=1) before library(OpenStreetMap), but that is not the error you are getting. What output do you get with running R CMD javareconf in the terminal?
I got it working. I’ll include everything I did for the benefit of others because reading the issues other people had was useful to me.
Here are the results
R CMD javareconf
Java interpreter : /usr/bin/java
Java version : 1.6.0_29
Java home path : /System/Library/Java/JavaVirtualMachines/1.6.0.jdk/Contents/Home
Java compiler : /usr/bin/javac
Java headers gen.: /usr/bin/javah
Java archive tool: /usr/bin/jar
Java library path:
JNI linker flags : -framework JavaVM
JNI cpp flags : -I$(JAVA_HOME)/include
Updating Java configuration in /Library/Frameworks/R.framework/Resources
Done.
I got different error messages when running R at the command prompt and in the R GUI that comes with the standard Mac distribution. Initially I thought I needed the Sys.setenv(NOAWT=1) only when running R at the command prompt (which then gave me the same error message as in the GUI). However, I do need to use it in the GUI.
I did some searching on Java errors because I though maybe the Java library path not having a value was causing the problem. I found this post that was very helpful https://stat.ethz.ch/pipermail/r-sig-mac/2011-August/008552.html.
The Java library path is not needed for OS X. However, they suggested
R CMD javareconf JAVA_CPPFLAGS=-I/System/Library/Frameworks/JavaVM.framework/Headers
I did that and the problem is fixed.
The following now works
Sys.setenv(NOAWT=1) #call this before loading OpenStreetMap
library(OpenStreetMap)
gpclibPermit()
library(rgdal)
map <- openmap(c(70,-179), c(-70,179))
plot(map)
Thanks for your help.
How can i transform Lat, Lon Data, so that i can overlay it? I have a data.frame df and i am doing the following
coordinates(df) <- ~Lon+Lat
Coordinates(df) has values like 11.110389 47.91413. (Lon, Lat).
take a look at the projectMercator function.
I tried your example:
map <- openmap(c(33.760525217369974,-118.22052955627441),
c(33.73290566922855,-118.17521095275879))
It worked fine. However when I changed the coordinates as in this example:
map <-openmap(c(42.84281,-89.84272),
c(43.29644,-89.00453)),
the computing took more than 5 minutes. So I had to interrupt it.
Any idea on why that boundary box (in Wisconsin) couldn't be found?
Thank you for the package.
You need to specify the bounding box as upper-left then lower right, so:
map <-openmap(c(43.29644,-89.84272), c(42.84281,-89.00453))
Ian,
Thank you for your response. It fixed the issue.
Modou
[…] Plot Maps Like a Boss […]
hmm….
I’m running Windows XP.
plot(map) returns a graphic of many pretty red crosses.
Java is installed. javareconf isn’t an option for R CMD. Any thoughts on what is wrong here?
Here’s my terminal dump:
Microsoft Windows XP [Version 5.1.2600]
(C) Copyright 1985-2001 Microsoft Corp.
C:\>java -version
java version “1.6.0_31”
Java(TM) SE Runtime Environment (build 1.6.0_31-b05)
Java HotSpot(TM) Client VM (build 20.6-b01, mixed mode, sharing)
C:\>R CMD
Usage: R CMD command args
where ‘command’ is one of:
INSTALL Install add-on packages
REMOVE Remove add-on packages
SHLIB Make a DLL for use with dynload
BATCH Run R in batch mode
build Build add-on packages
check Check add-on packages
Rprof Post process R profiling files
Rdconv Convert Rd format to various other formats
Rdiff difference R output files
Rd2dvi Convert Rd format to DVI
Rd2pdf Convert Rd format to PDF
Rd2txt Convert Rd format to pretty text
Stangle Extract S/R code from Sweave documentation
Sweave Process Sweave documentation
config Obtain configuration information about R
open Open a file via Windows file associations
texify Process a latex file
Use
R CMD command –help
for usage information for each command.
C:\>
Are you connected to the internet :). The red crosses come up when the tiles are unable to download.
Ha Ha. Yes, I am connected. install.packages() etc works just fine.
And what of the javareconf problem?
I have a Linux install. I’ll try that and report back.
Cheers,